

F8 Studio
F8 Studio is the browser UI for Fallen-8: a React single-page app. The default compose environment runs it as its own standalone container (F8 Studio on :8081, the REST API on :8080); the API app can also serve it from its own wwwroot (the all-in-one image). Build and serving are covered in running.md. It is a workbench over one instance’s REST surface (connect to a server, inspect and mutate a graph, run queries and algorithms, visualize results) and, because Fallen-8 has no query language (delegates.md), it gives humans and code-generating agents a place to author, validate, and refine the C# delegate fragments that queries are made of.
Layout
Section titled “Layout”A fixed icon rail on the left switches screens; a top bar names the active instance (dropdown), the active namespace (dropdown), and the resulting endpoint prefix (baseUrl → /ns/{ns}/*), with a link to these docs plus the events bell (below), live-feed and health chips pinned right. Every screen except Connect is locked until the active instance answers GET /status and the credential is authorized. The rail scrolls within itself when a short window cannot fit every entry, so nothing is ever cut off the bottom.
Switching instance or namespace keeps you on the screen you are on. On a namespace-scoped screen only the namespace in the URL changes (/q/{old}/query → /q/{new}/query); on a flat one (Connect, Save games, Integrations) nothing navigates at all, because those read the active namespace and update in place. Either switch remounts the current screen, so in-progress results never leak across contexts. The same rule applies to the two ways out of a namespace this process cannot read: they land you on the same screen in default.
The top bar is also where the counts live: the namespace dropdown carries the active namespace’s vertex and edge totals, live, on every screen - which is why there is no separate status screen. A bookmark to the former Dashboard (/dashboard, /q/{ns}/dashboard) forwards to the Browser in that namespace.
A namespace the server did not load is marked rather than hidden: the switcher’s dot goes faint and its row carries a not loaded tag, ahead of active and bare-URL alias in the one tag slot, because the other two are already said elsewhere while residency is the one state that changes what every screen can do. Opening such a namespace replaces the screen with a short explanation in prose (the namespace exists, its graph and its write-ahead log are untouched on disk) and an Activate now button, which loads it into the running process via POST /ns/{name}/activate and brings the screen back without a restart; a refused activation is shown inline with the server’s own reason. Activating does not change the persisted at startup policy, which is what the next boot honours: to keep the namespace after a restart, also set that policy to load in the Connect screen’s Namespaces panel. The branch deliberately does not offer the “Recreate (empty)” button that a genuinely missing namespace gets, which here would erase exactly what you came back for. In an embed pinned to one namespace, the explanation still appears but none of the buttons do: an embed must not re-plan its host’s boot (namespaces.md).
Each screen’s input form and the Canvas contents are remembered per instance-and-namespace: leaving a screen and returning restores exactly what you had entered. Fetched results are re-run on demand rather than persisted. Instances you register, and their API keys, live only in this browser’s local storage.
Connect, Save games and Integrations keep flat routes: the first two are Fallen-8-level (they span namespaces), and an integration job names the namespace it writes into rather than inheriting it. Every other screen operates on the active namespace and lives under /q/{ns}/…, Benchmark included.
A low-key Replay intro button is pinned to the bottom of the rail and is always available: it plays the first-run walkthrough (below) on demand.
A Durability banner appears under the top bar when the server has something to warn about, and only then: the write-ahead log is degraded (commits are landing in memory only, so a restart loses them), the last recovery was truncated (this graph is a prefix of the committed history, which matters to anything reconciling against it), or the last checkpoint dropped indexes (they will be missing after the next load; one REST call rebuilds an index from element state, see indexes.md). Each says what it means and what to do. It is shell chrome rather than one screen’s content, so it reaches you wherever you are working. There is deliberately no green “all durable” badge: a badge that is always there stops being read, and these three states are the ones worth interrupting for. A server too old to report the block says nothing rather than claiming health. What the three states mean underneath is in save-games.md.
Every screen also carries a How does this work? button in the top bar, next to the docs link. It opens a small popover listing the one to three documentation pages that explain the current section, each opening here in a new tab, so the relevant deep dive is one click away from wherever you are.
| Screen | Scope | Purpose |
|---|---|---|
| Connect | Fallen-8 | Register instances, instance configuration (providers, observability, every setting behind Configure), manage namespaces |
| Samples | namespace | One-click demo-graph gallery with a capability tag filter |
| Save games | Fallen-8 | Checkpoint registry (load / delete) + administration (save/load/erase, jsonl import/export) |
| Browser | namespace | Look up an element, inspect properties/embeddings, adjacency, bulk view, mutations |
| Query | namespace | Property scans (one named key, or a contains search across all properties), index queries (equality/range/fulltext/spatial/vector), and semantic search by typed words |
| Indexes | namespace | Create and manage indexes and their content |
| Traverse | namespace | Three tabs: route finding (BLS / Dijkstra) with filters, costs, semantic scoring; subgraph lifecycle + pattern builder; the stored-query library both share |
| Analytics | namespace | Graph shape + run algorithms with write-back |
| Plugins | namespace | Built-in plugin families + the runtime-authored plugin registry |
| Canvas | namespace | 2D/3D visualization of whatever you send to it |
| Benchmark | namespace | Optionally generate a random graph, measure edge-traversal throughput on any loaded graph |
| Knowledge | namespace | The semantic layer: index binding, document ingest, entity network, chunk search |
| Integrations | namespace | Run an integration against a system on your own network and read its report. Present only when the instance has an integrations runtime |
Events
Section titled “Events”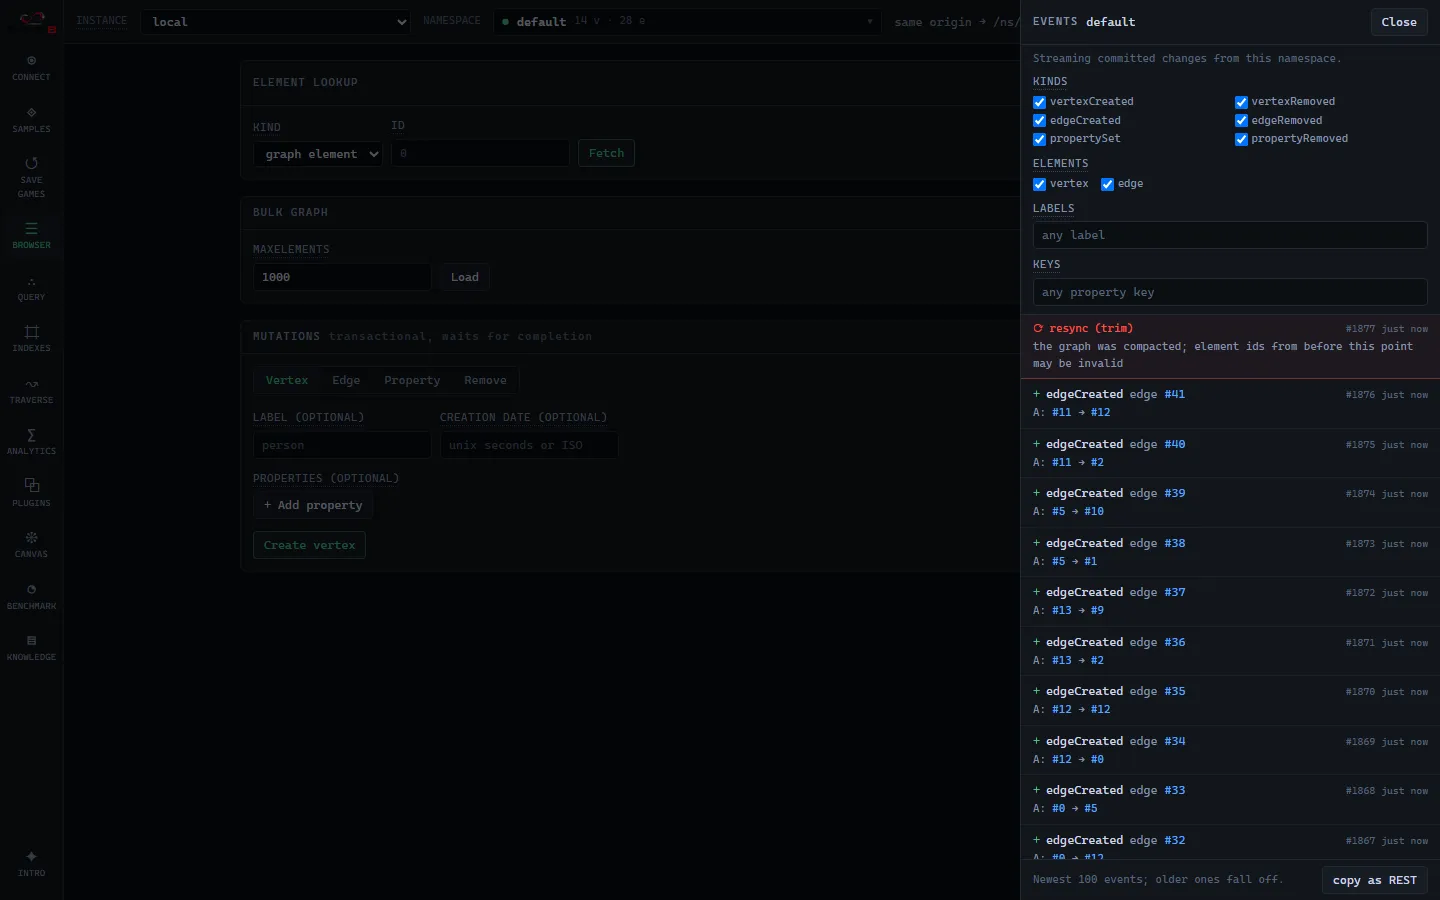
The bell in the top bar is the change feed made visible. Without being clicked, it counts the events matching your interest filter (display capped at 99+), and it switches to a warning when the stream lost continuity (a resync) while you weren’t looking. Clicking it slides in the Events panel: the newest 100 events of the active namespace, newest first, live as they commit, from any client of the same instance (another tab, curl, an MCP agent). Each row shows the kind, the element id as a click-to-inspect link into the Browser, the label, the property key for property events, the edge type and endpoints for edge creations, the sequence number, and the commit time. Event payloads carry keys only, never property values; the link is how you reach the current value. resync entries render as gap markers with the reason (buffer overflow, graph replaced, catch-up position out of range, direct delegate write).
The filter block speaks the REST grammar verbatim: kinds, elements, labels, and keys combine with AND across dimensions and OR within one, matching exactly and case-sensitively; an unlabeled element never matches a labels filter, and a keys filter hides creations/removals (only property events carry a key). Studio holds a single stream per namespace and applies the filter in the browser, so changing it is instant, applies to the badge as well as the list, and can reveal already-buffered events; the filter persists per instance and namespace. Copy as REST hands the configured filter over as the equivalent GET /changefeed query for curl or a service, never including the API key. Switching namespaces (or instances) and back resumes the stream from the last seen event, so what happened while you were away replays from the server’s catch-up buffer; when it no longer can, a resync entry says so instead of silently skipping. The event list itself is session-only: a reload starts it empty, since the server keeps no readable history beyond its replay buffer.
First run
Section titled “First run”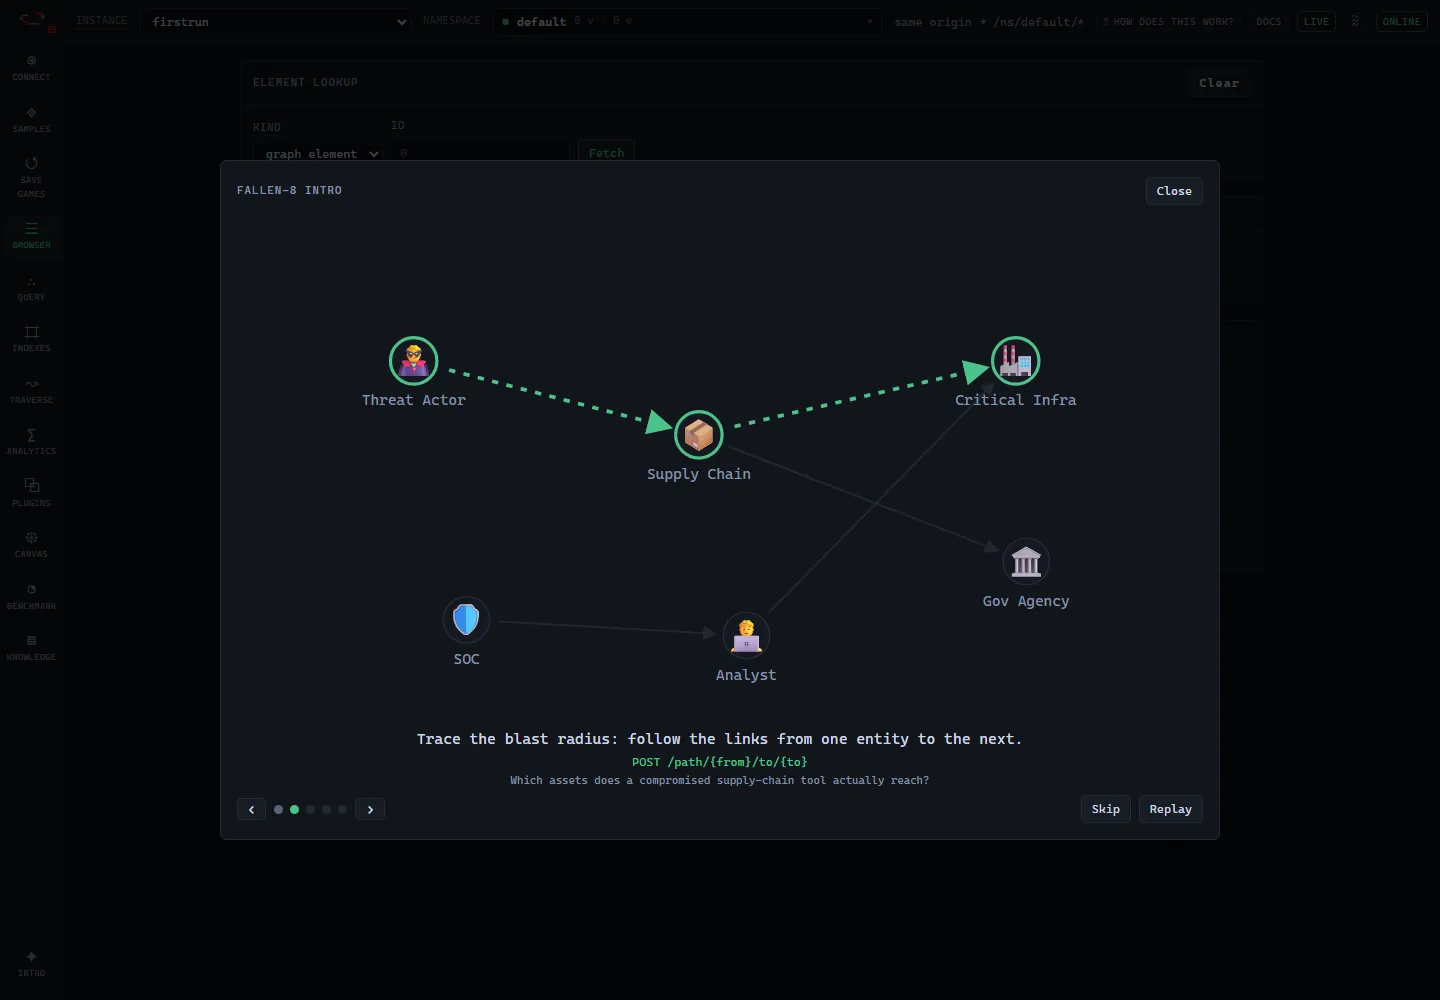
On an empty namespace Studio opens a short animated walkthrough by itself, as an overlay over the screen you are on. It waits for a screen that is about a graph: on Connect, Save games and Integrations it stays silent, because those are where you wire a graph up and a modal on top of a half-finished instance registration is an interruption rather than an introduction. It plays through five beats on a small built-in mock graph (“Asymmetric Cyber Warfare”: a threat actor, a compromised supply-chain tool, its targets, and the defenders, drawn with emoji nodes and directed arrows), each with one line of caption: a graph is entities and typed relationships; trace the blast radius from one entity to the next (POST /path/{from}/to/{to}); rank what matters with analytics (POST /analytics/PAGERANK); extract a matched pattern as its own recalculable graph (PUT /subgraph); and search by meaning then expand (POST /scan/index/vector). It then rests on a handoff: Browse sample graphs (opens the curated Sample gallery), Import your own data (JSONL to POST /bulk/import), or Explore on my own.
Each beat holds for about ten seconds, and Prev / Next / the step dots (plus the Left/Right arrow keys) let you step through the features at your own pace; a manual step pauses the autoplay. The show is entirely client-side and read-only: it draws the mock as SVG and animates it, and it creates nothing. Only the handoff buttons act, and only on click. It is skippable and replayable, pauses when the tab is hidden, and honours prefers-reduced-motion by rendering the final framed state with no motion. Closing it - by the Close button, Escape, the scrim, or “Explore on my own” - is remembered per namespace, so it does not come back; it reappears only if that namespace is genuinely empty again. It also stands down entirely while the Durability banner (above) has something to say: a truncated recovery is a leading reason a namespace you expected to hold data is empty, and that warning must not end up behind a walkthrough’s scrim. Replay intro in the rail reopens the same walkthrough at any time, on the mock graph, over whatever screen you are on, without touching your data or the dismissed state - including on a populated graph, or while the instance is unreachable. The same graph ships as the Asymmetric Cyber Warfare sample so you can load the real thing in one click.
Connect
Section titled “Connect”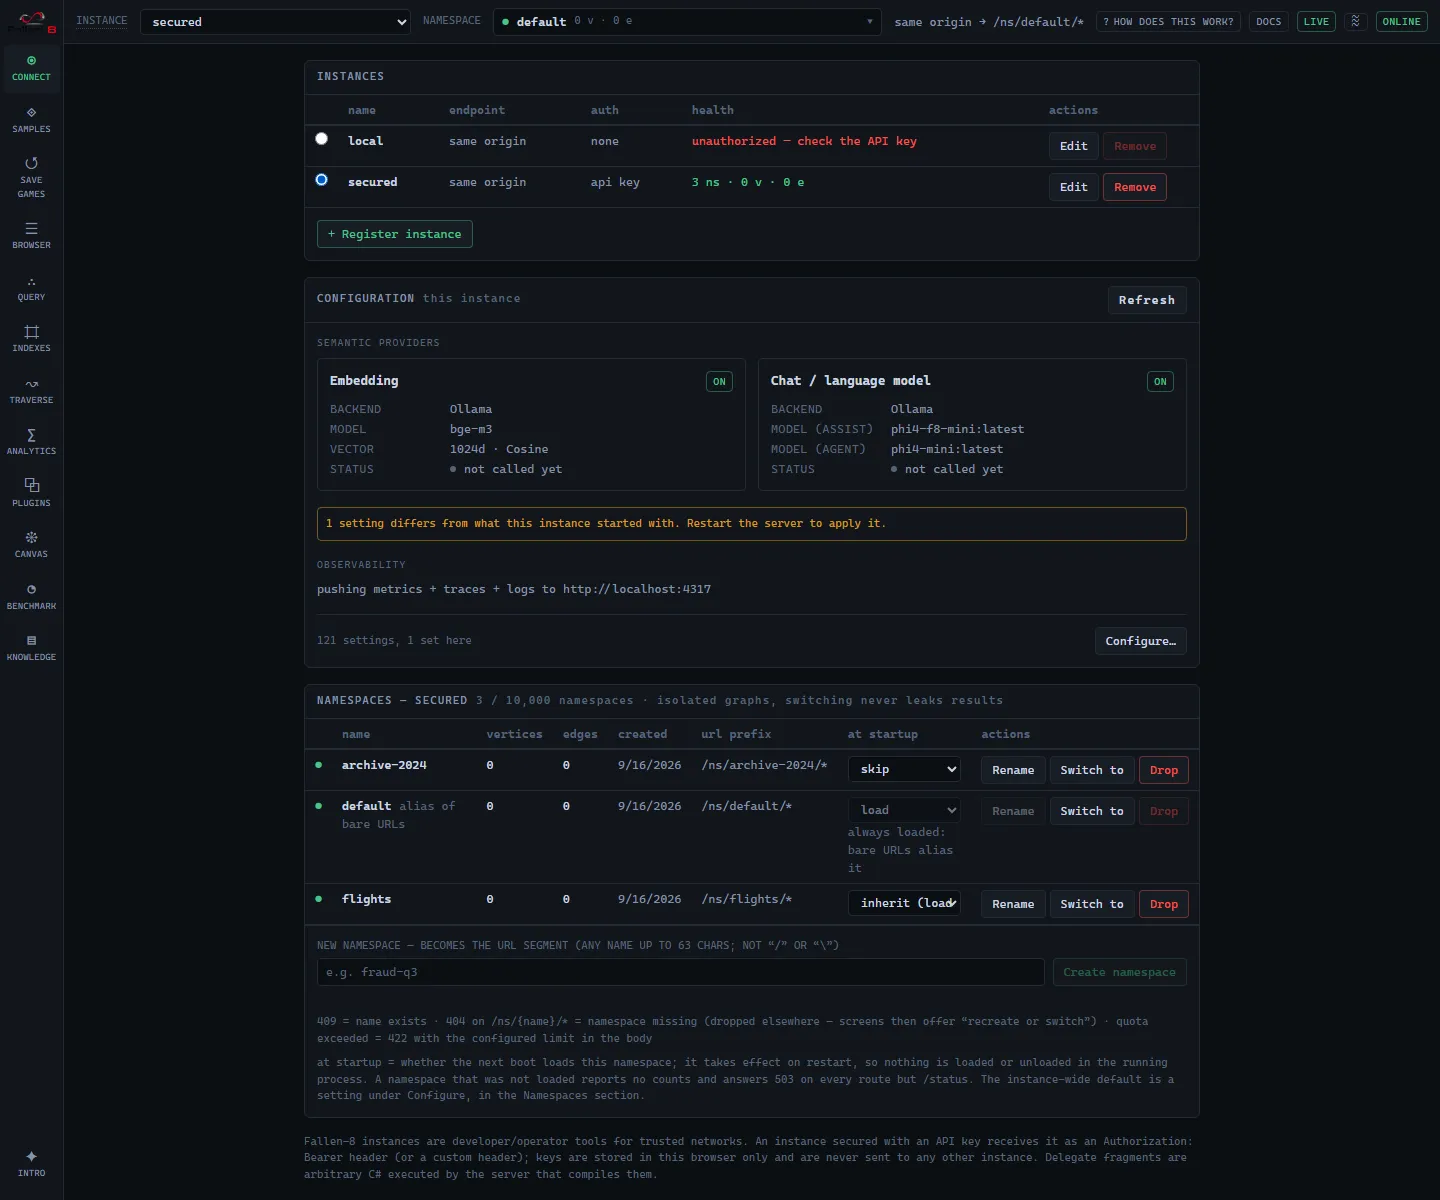
Three panels, and one surface behind the middle one. The Instances table lists registered servers with a radio to activate one, its endpoint and auth kind, and a live health cell describing the WHOLE instance: N ns · V v · E e, the namespace count with the vertex and edge totals summed over every namespace (namespaces.md), or unreachable / unauthorized. A namespace the server did not load reports no counts, and those are never folded in as zeros: the totals are then marked >= with the tooltip naming how many are missing, and read as dashes when none reported at all. Reachability and the credential verdict come from the anonymous GET /status probe, which is also the fallback if the namespace inventory cannot be read - labelled default: there, because a bare probe describes that one namespace and not the instance. “+ Register instance” takes a name, a base URL (empty = same origin as Studio), and an optional API key; keys are stored in this browser only and sent as a bearer/custom header (security.md). When Studio is deployed standalone, the endpoint it was configured with appears as a managed default instance while the ones you add here are personal. The two differ in what persists and in whether they can carry a credential, and a key-secured server needs a personal instance: managed vs personal. A cross-origin instance that reads unreachable while its server is up is usually a missing CORS allow-list entry, and the health cell says so. The Configuration card (below) summarises the active instance’s providers and posture, and its Configure button opens the surface holding every setting it binds. The Namespaces panel manages the active instance’s namespaces, create, rename, switch to, drop, with counts and the /ns/{name}/* URL prefix; default aliases the bare routes and cannot be renamed or dropped (namespaces.md). Each row also carries an at startup selector (load / skip / inherit): the server-side policy deciding whether the next boot loads that namespace at all, so it is labelled as taking effect on restart and nothing is loaded or unloaded in the running process by changing it. On default the selector is disabled with the reason under it, because bare URLs alias it and it is always loaded. A namespace the server did not load keeps its row here, with its state dot faint (the state itself is the dot’s tooltip) and a dash in place of each count, since a zero there would be a claim this instance cannot make; the panel’s footnote adds that such a namespace answers 503 on every route but /status (namespaces.md).
The Configuration card is this instance’s own configuration home, sourced from GET /config. On the card itself: the semantic providers, meaning the embedding provider (backend / model / dimension / metric) and the chat gateway (backend / model), each with a live status line saying whether the model is loaded right now and, when the backend reports it, whether it sits on the GPU or the CPU (a model that has not been used yet reads “not loaded (loads on first use)”, and a backend that cannot answer the residency question falls back to “in use” / “not called yet” rather than guessing - see model-providers.md); a one-line observability status (“pushing metrics + traces + logs to <endpoint>” / “Prometheus at /metrics” / off); how many settings the instance publishes and how many it has stored itself; and a count when a stored value differs from the one the process started with. Secrets are never shown (only whether an API key is required). See semantic-traversal.md and observability.md.
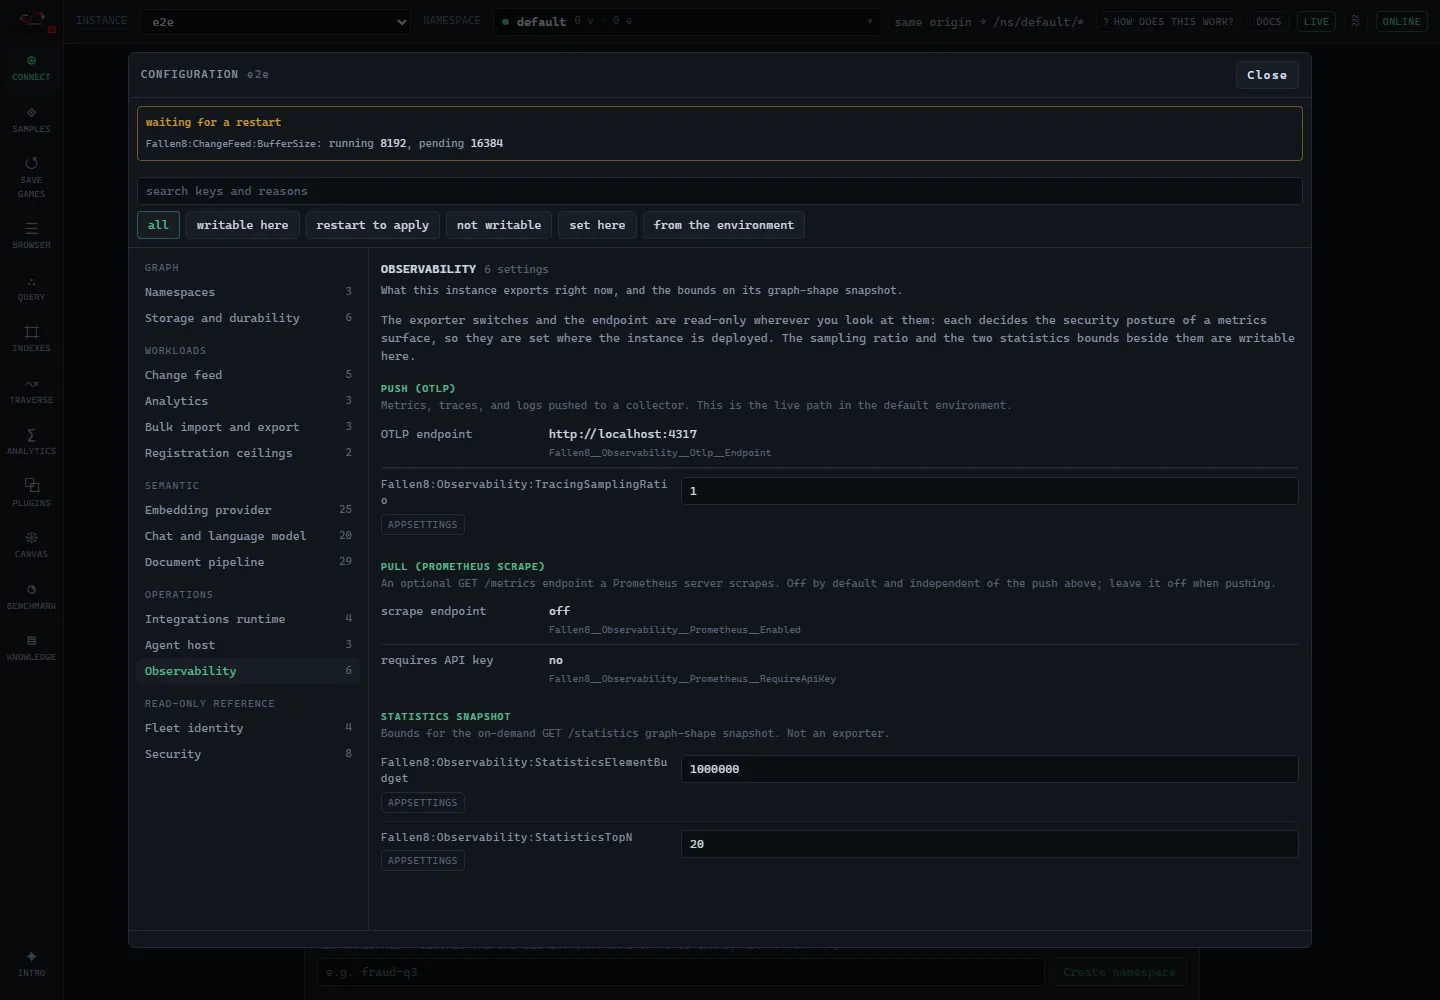
Configure opens the settings themselves, in a surface of their own. It holds every setting the instance binds with its value, the layer that value came from, and whether it may be changed: most writable settings take effect at the next boot and each row says so, a setting the environment declares renders read-only with the variable named underneath it, and a setting that is never writable shows the reason instead of a dead control. They are grouped into sections with a nav down the left, one section at a time, and there is a search across all of them plus filters for writable, restart-pending, not writable, set here and environment-declared. Editing needs an API key and Fallen8:Security:EnableConfigurationWrite; without them everything is read-only and the surface says why. The Observability section of that surface groups the exporter values under Push (OTLP), Pull (Prometheus scrape) and Statistics snapshot, so the live push path is never mistaken for the off-by-default scrape endpoint, with the Fallen8__… env key under each read-only row, and the sampling ratio and the two statistics bounds editable. The full model, including why roughly half of the settings are not writable, is on configuration.md.
Samples
Section titled “Samples”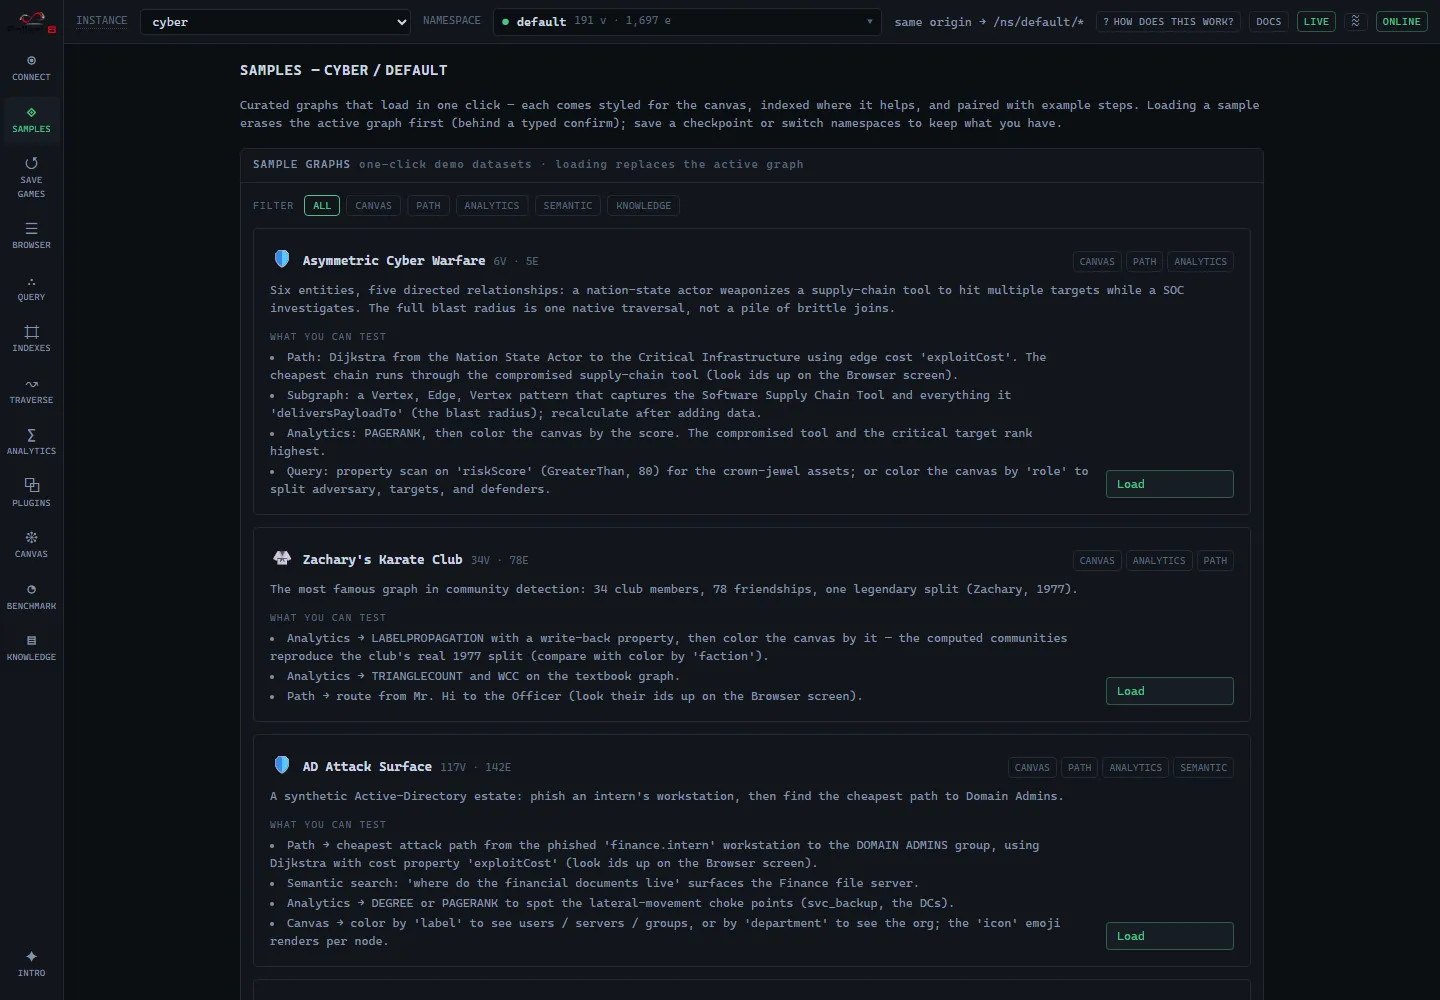
The one-click demo-graph gallery. Each full-width card names a curated dataset, its vertex/edge counts, its capability badges, and a what you can test list; Load fetches the dataset, imports it, builds its indices, and drops it onto the canvas with the sample’s style. A tag bar at the top filters the gallery by capability, offering only the tags the shipped manifest actually uses (currently canvas / path / analytics / semantic / knowledge). A live Any GitHub repo card ingests any public repository’s dependency graph just-in-time, and a Scale card points at the Benchmark tab’s server-side generator. Loading into a non-empty graph erases it first behind a typed confirm, save a checkpoint or switch namespaces to keep the current data. Walkthrough with queries: samples.md.
A sample that carries documents does more on load, and the progress line names each step: after importing it fills its equality indexes key by key (index creation does not backfill), binds the semantic layer, and ingests the manifest’s documents through the live /document pipeline, then reports the index keys written and the documents and chunks created. Because that runs for real, such a card can also refuse to load, saying why: ingestion off, the embedding provider off, or the docling sidecar unreachable when the sample uploads a binary format. A missing NLP sidecar only warns: the documents load without the entity network.
Browser
Section titled “Browser”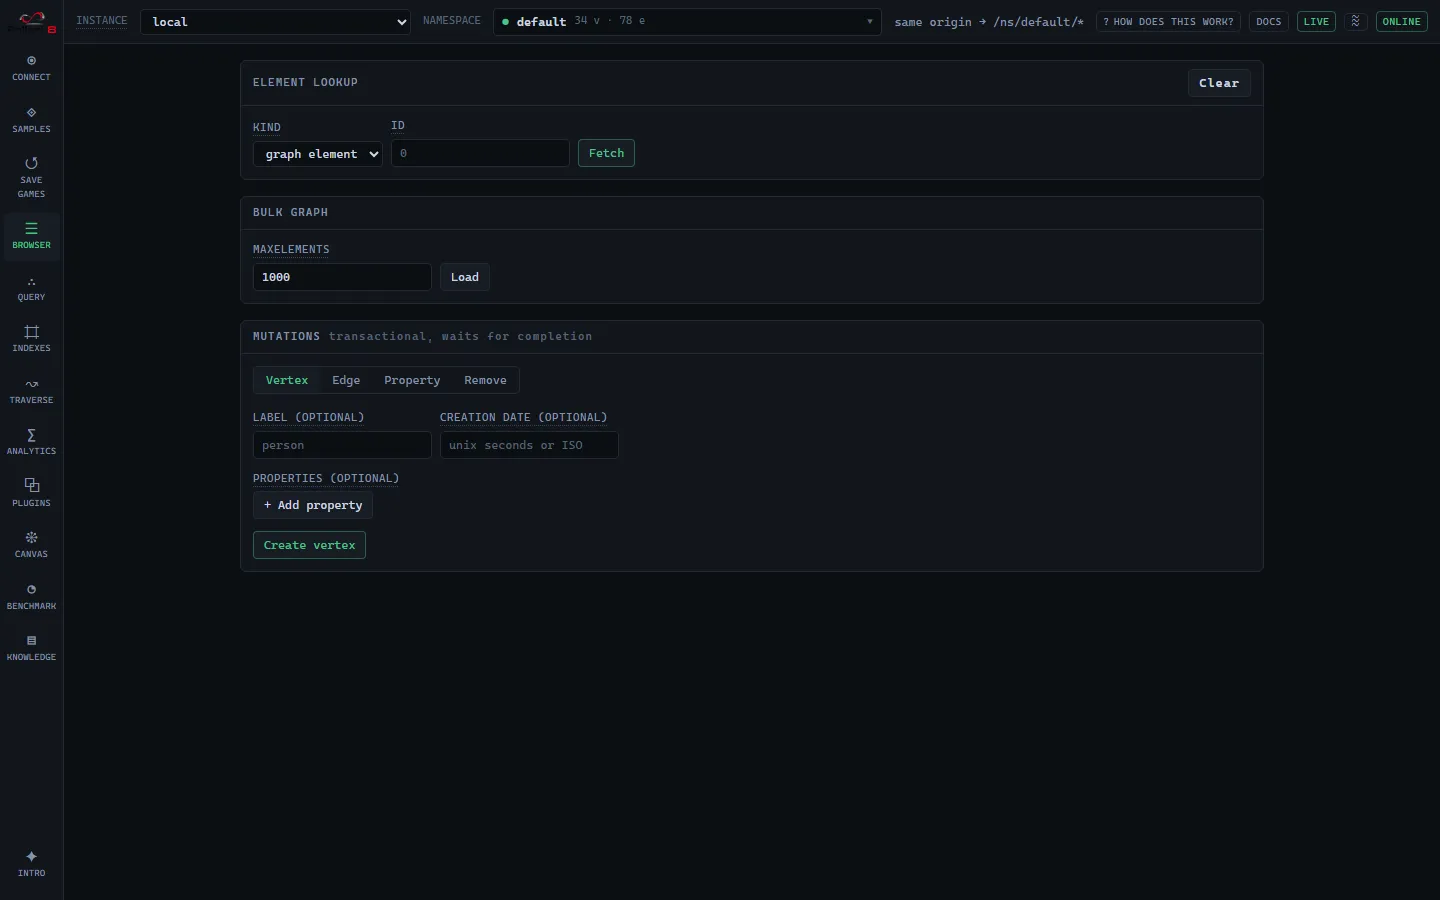
Look up a graph element, vertex, or edge by id. The inspector shows the label, timestamps, edge endpoints, and two tabs: Properties, and Embeddings to set, replace, or remove a named embedding on the element from a pasted vector or (with the provider) from text (semantic-traversal.md). Where a vector index is bound to one of the element’s embeddings, that row also offers Find similar, which searches the bound index with the element’s own vector, constrains the search to the element’s label, and drops the element itself from the hits. An adjacency panel lists neighbors with degrees for one-click hopping, and a bulk view loads up to maxElements with a truncation badge and a filter. A mutations panel creates and edits vertices, edges, and properties (graph-model.md). “Send to canvas” is available throughout.
Knowledge
Section titled “Knowledge”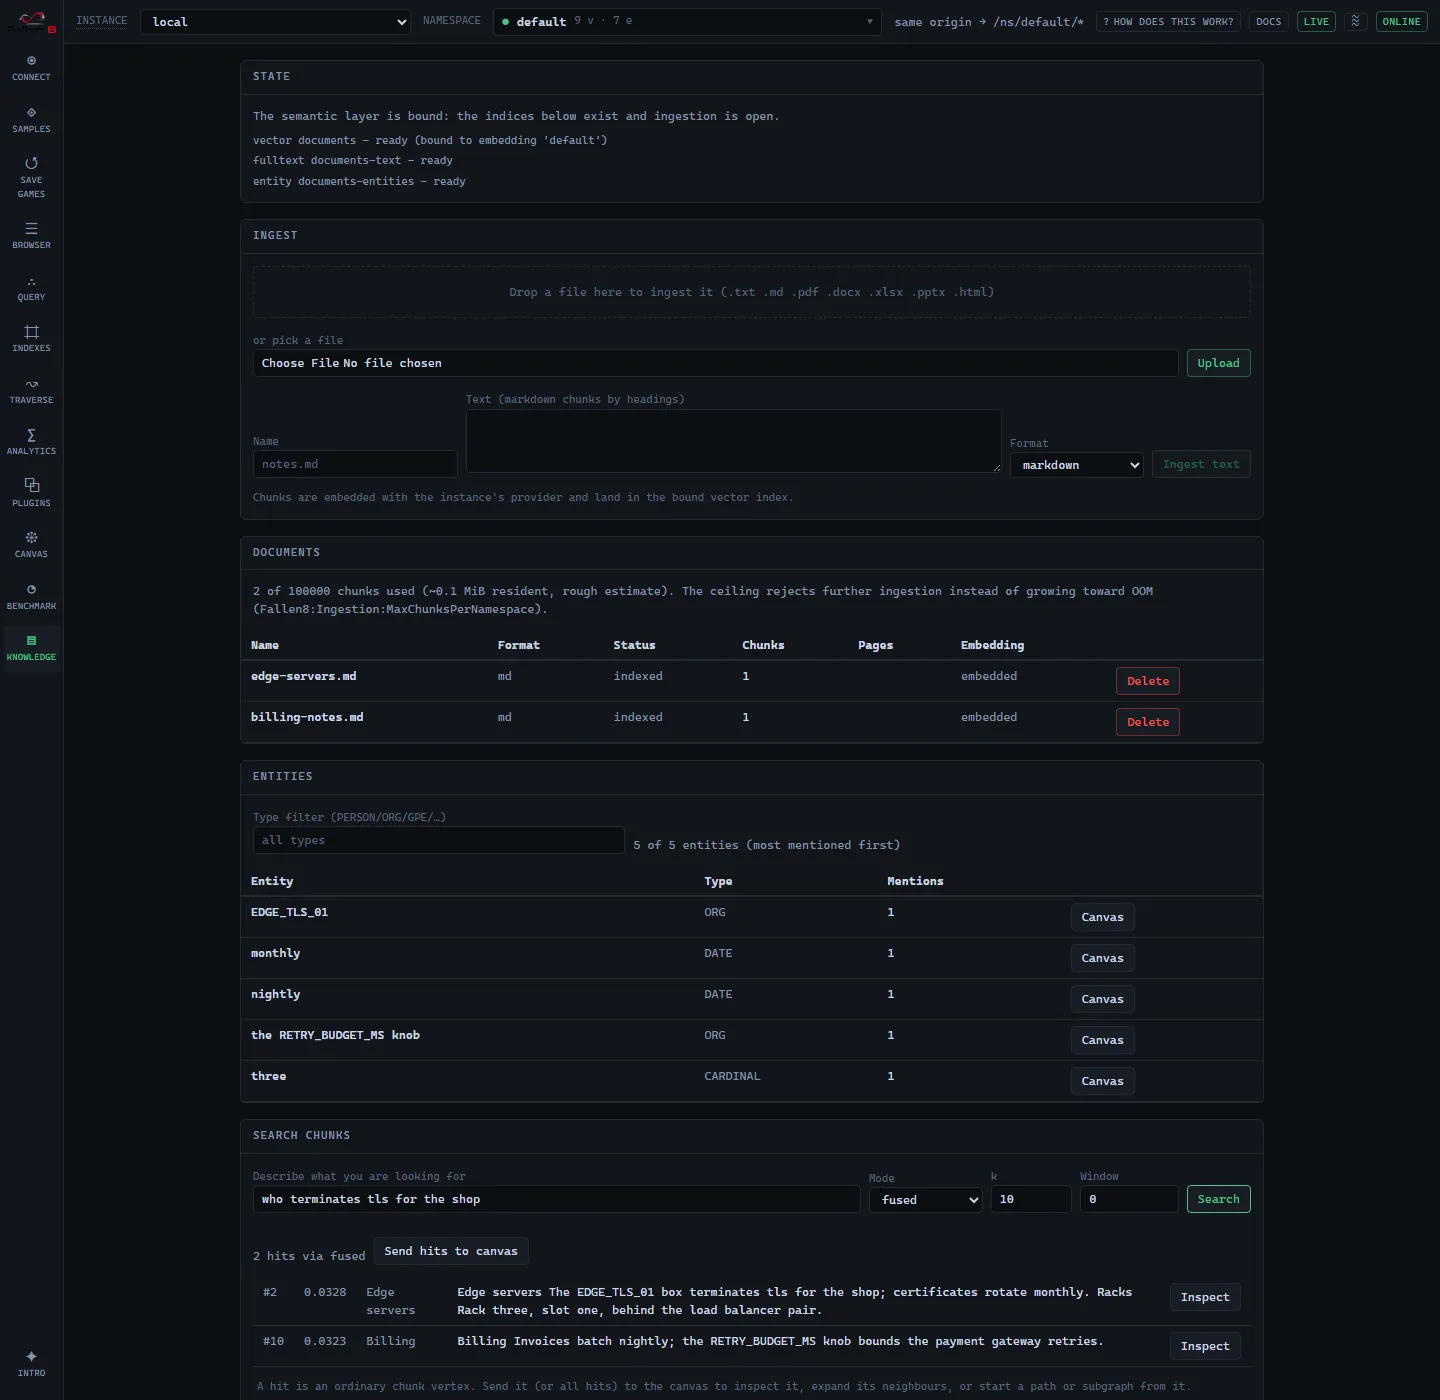
Documents in, graph out (unstructured-ingestion.md): the semantic layer over the graph, last in the rail after Benchmark. A State panel reports the index binding and creates the required indices on request (nothing is created implicitly; ingestion is refused until the layer is bound). Drop a file on the dropzone or paste text, watch the ingest land live (it is queued and its row flips from processing to indexed over the change feed), browse the deduplicated entity network the text mentions, and search the chunks. A document row expands into its chunks (order, kind, heading path, extracted identifiers, a text preview) and can be deleted, which cascades its chunks and every edge on them behind a typed confirm.
Search chunks takes the query text, a mode (fused, or dense / lexical to isolate one retrieval side), k, and a neighbour window to expand each hit with, and it names the mode actually used, so a fused run that degraded to one side is visible rather than silent. “Send hits to canvas” turns hits into ordinary chunk vertices there, ready to inspect, expand, or use as path seeds; a single row’s Inspect sends just that chunk. The screen gates on the instance’s ingestion capability and states its degraded modes plainly: provider off means text-only ingest, docling sidecar unreachable means txt/md only. A budget line tracks chunk usage against the enforced namespace ceiling.
Integrations
Section titled “Integrations”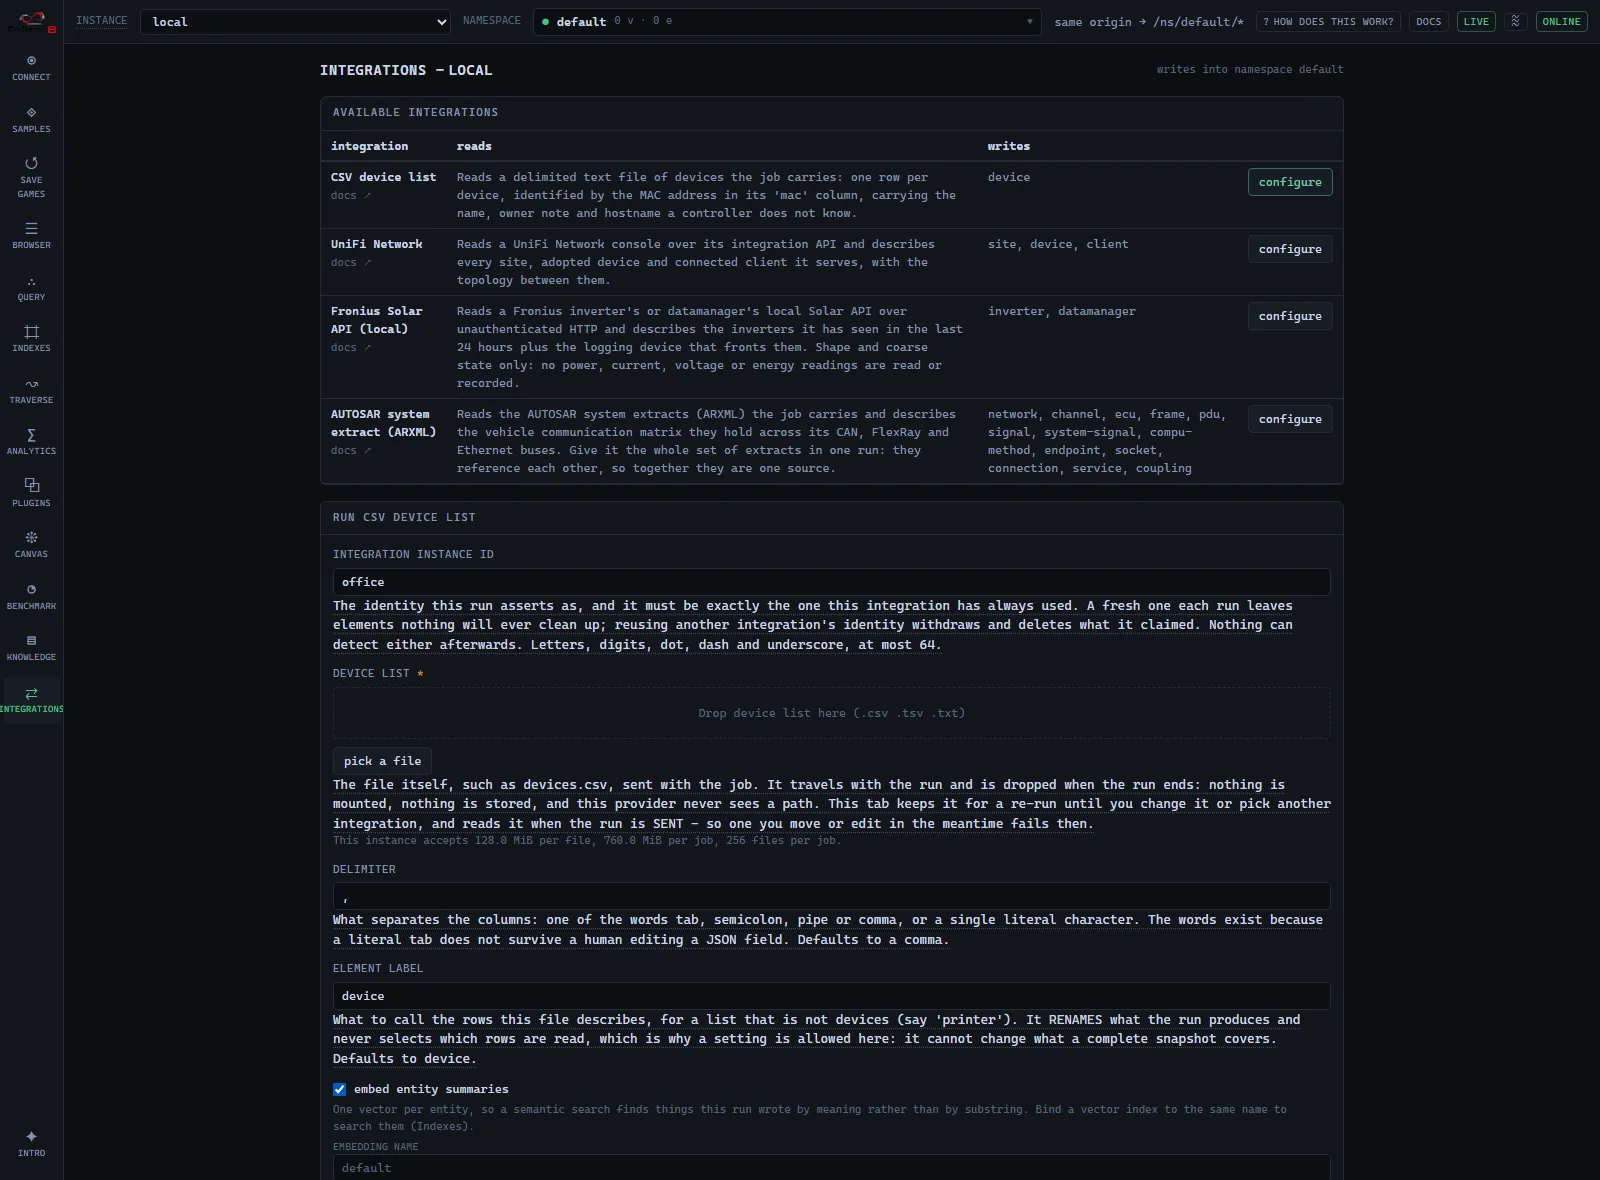
Run an integration against a system on your own network. The screen is rendered from the runtime’s descriptors alone - nothing about any particular integration is coded here - so the Available integrations table (what each one reads, and what kinds it writes) and the run form below it appear for a fourth integration the moment the runtime offers one. A row says what its integration reads in a sentence and links its own documentation for the rest, which is the descriptor’s doing too: a provider that names no page simply shows no link.
The form is the descriptor’s own settings, in its own words: required fields marked, defaults pre-filled, and run now disabled until the ones it cannot run without are there (it says which). The integration instance id is the identity the run asserts as, and the screen spells out what that means, because it is the one field nobody can fix afterwards: a fresh id leaves the previous run’s elements claimed by nothing, and reusing another integration’s id withdraws and deletes what that one owned. A credential setting is used for the single run and then forgotten - nothing stores it and no report echoes it - so it is typed here each time. A file setting is a dropzone and a file picker, the same gesture the Knowledge screen uses: drop the CSV or the ARXML extract, and its bytes travel with the run and are dropped when it ends - nothing is mounted and nothing is stored (Files). The field states what the instance accepts, read from the instance itself, and a set over any of those ceilings is refused here rather than after the upload; the refusal names the file, its size and the ceiling it broke. Studio keeps no ceiling of its own, so on an instance that will not report them nothing is checked before the send and the field says so, which is the honest state rather than a guess that could refuse a job the instance would have taken. A setting the integration declares takes several files stages a numbered list instead, because a vehicle network arrives as one extract per domain: each row shows its own size and can be removed on its own, the total is shown because there is a ceiling on it, and the numbering is not decoration - where two files declare the same thing, the one listed first wins (One setting, several files). Submitting streams the files straight from disk, so the browser never holds them and the size of what you can send is the instance’s business rather than the browser’s. The button reports how far the send has got and can be cancelled while bytes are still going out: nothing is sent and no run is started, which matters because a staged set can be gigabytes. Once the whole body has gone the cancel is withdrawn rather than left to look effective, because from that point the runtime may already have accepted the job, and a run deliberately outlives the request that began it: it is stopped from the run panel instead. Once the runtime accepts the job the run panel takes over and shows the report: what it created, matched, withdrew and deleted, plus any diagnostics, which is the honest account of one run rather than a success toast. One consequence worth knowing: a staged file is read when the job is sent, not when it is picked, so one you move, rename or edit in between fails at the send, and the screen says so.
While a run is in flight the panel tracks its phase and re-attaches after a reload, and it can be stopped: a two-step control that asks the run to end at its next safe point. A stopped run keeps what it wrote and withdraws nothing, which the panel says, and the wait between asking and stopping is real during the embedding phase, so the control reports that it is stopping rather than pretending it already has. If the runtime was restarted mid-run, the panel says the run was picked up and continues where it stopped (Stopping one, Restarts).
The screen is present only when the instance has an integrations runtime behind its proxy; without one it says so instead of offering a form that cannot work.
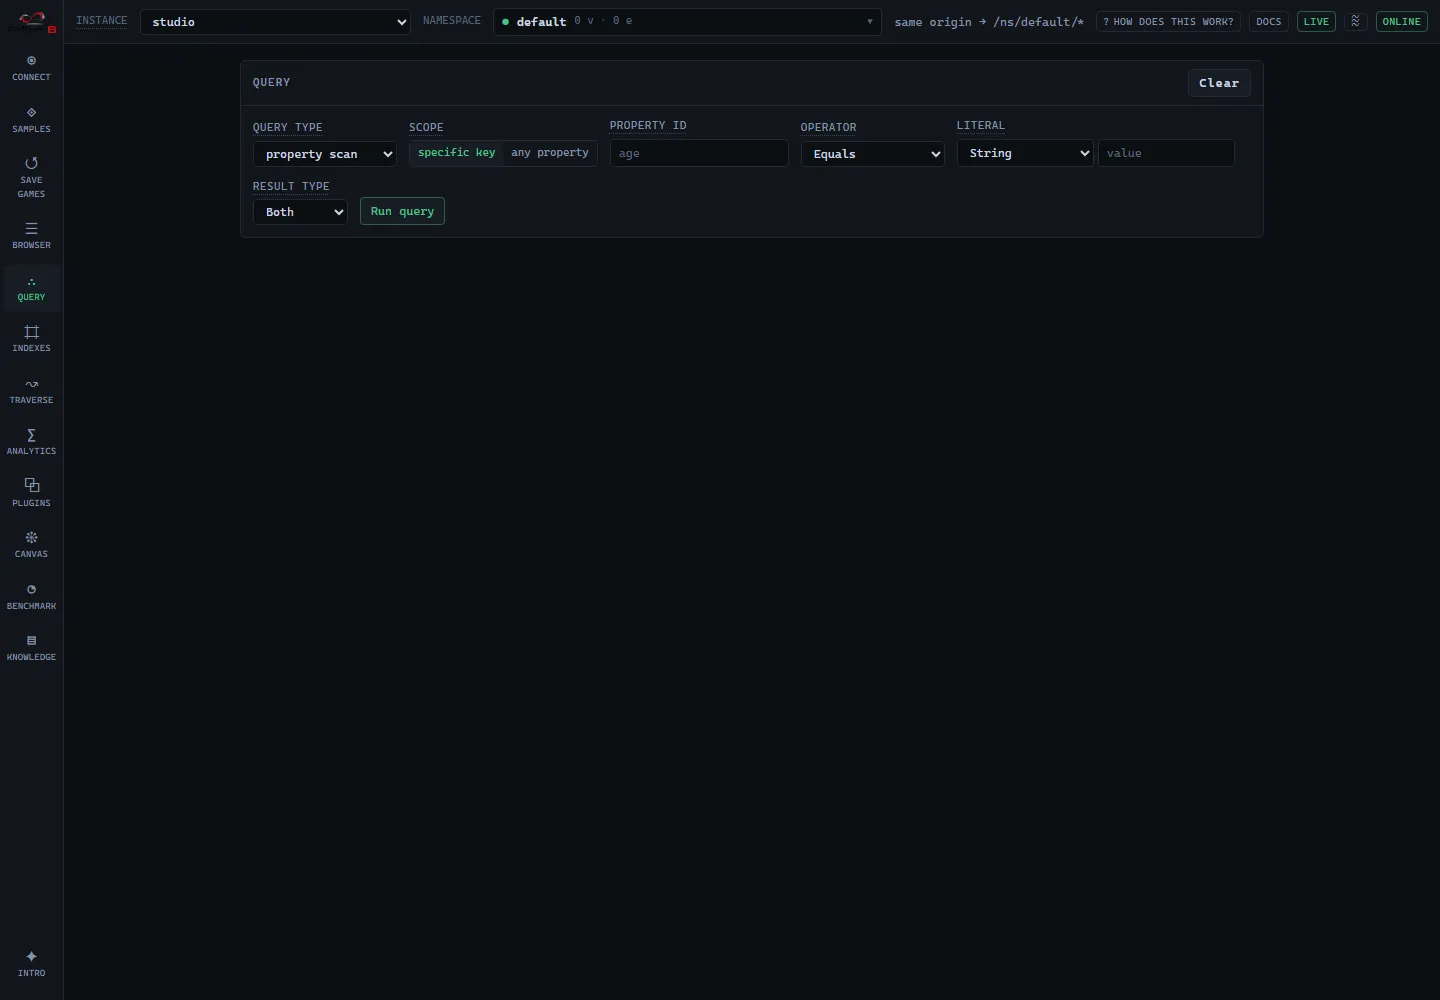
Three modes. A property scan has two scopes, both taking a result type (Vertices / Edges / Both): specific key takes a property id, a comparison operator, and a typed literal; any property takes a single search term and an optional label restrictor, and returns the elements any of whose property values contains the term (case-insensitive, values compared as text so numbers and dates match too). It is a cold, un-indexed full-graph scan meant for discovery; index a property for repeated or large-graph lookups. Ask an index picks from the live inventory and offers only the forms the index answers: equality/operator, range, fulltext, spatial, or vector (kNN). A vector query there is a vector you already have, pasted, with k, an element-kind filter, and a label constraint.
Semantic search is the third mode, and the one that needs no knowledge of the data model: type words, and the embedding provider turns them into the query vector server-side before the kNN runs. The picker is narrowed to the indexes that report the vector family, names the embedding a bound one projects, and preselects the only one when there is only one. Because embeddings live on the elements themselves, an instance can carry thousands of them and still have nothing to rank them with; in that case this mode offers the one thing that fixes it, a bound vector index prefilled from the provider’s own dimension and metric, and drops you into the search as soon as it exists. The query box stays on screen while it does, so you can write what you are looking for first. With the provider off the mode is still there and says so once: where a vector index exists it points at the pasted-vector form, which works without a provider, and where none does it says to create one first. On an instance that has not answered yet it says that instead of guessing what it holds.
Results report the id count, a vector metric legend (higher/lower is better), fulltext highlights, and a scored table; send the whole result set to the canvas, or add a single row’s element with its per-row canvas action. Index semantics live in indexes.md and vector-search.md.
Stored queries are not managed here: a stored query is unique to its scenario (Path or SubGraph), so it is registered on the Traverse screen’s two scenario tabs, next to the fragments it captures, and managed on that screen’s Stored queries tab (stored-queries.md).
Canvas
Section titled “Canvas”Renders exactly what you send from the Browser, Query, Traverse, Analytics, Knowledge, or Samples screens; it never loads anything on its own. Two toolbar actions control that working set, both view-only (the database is never touched). Show whole graph is the one explicit way to put everything on the canvas in a single click: it merges up to 20,000 vertices and 20,000 edges into the view, and when the namespace is bigger an honest “showing the first X of Y” notice appears next to the element count instead of silently pretending the graph is complete. Clear view empties the working set entirely: nodes, edges, the path overlay, and the current selection; your style configuration and the other screens’ state survive.
The right-hand panel is a tool strip with four tabs (Style, Find, Connect, and Interact) over a shared detail panel that always shows whatever node or edge you have selected. Style, the default tab, is sectioned:
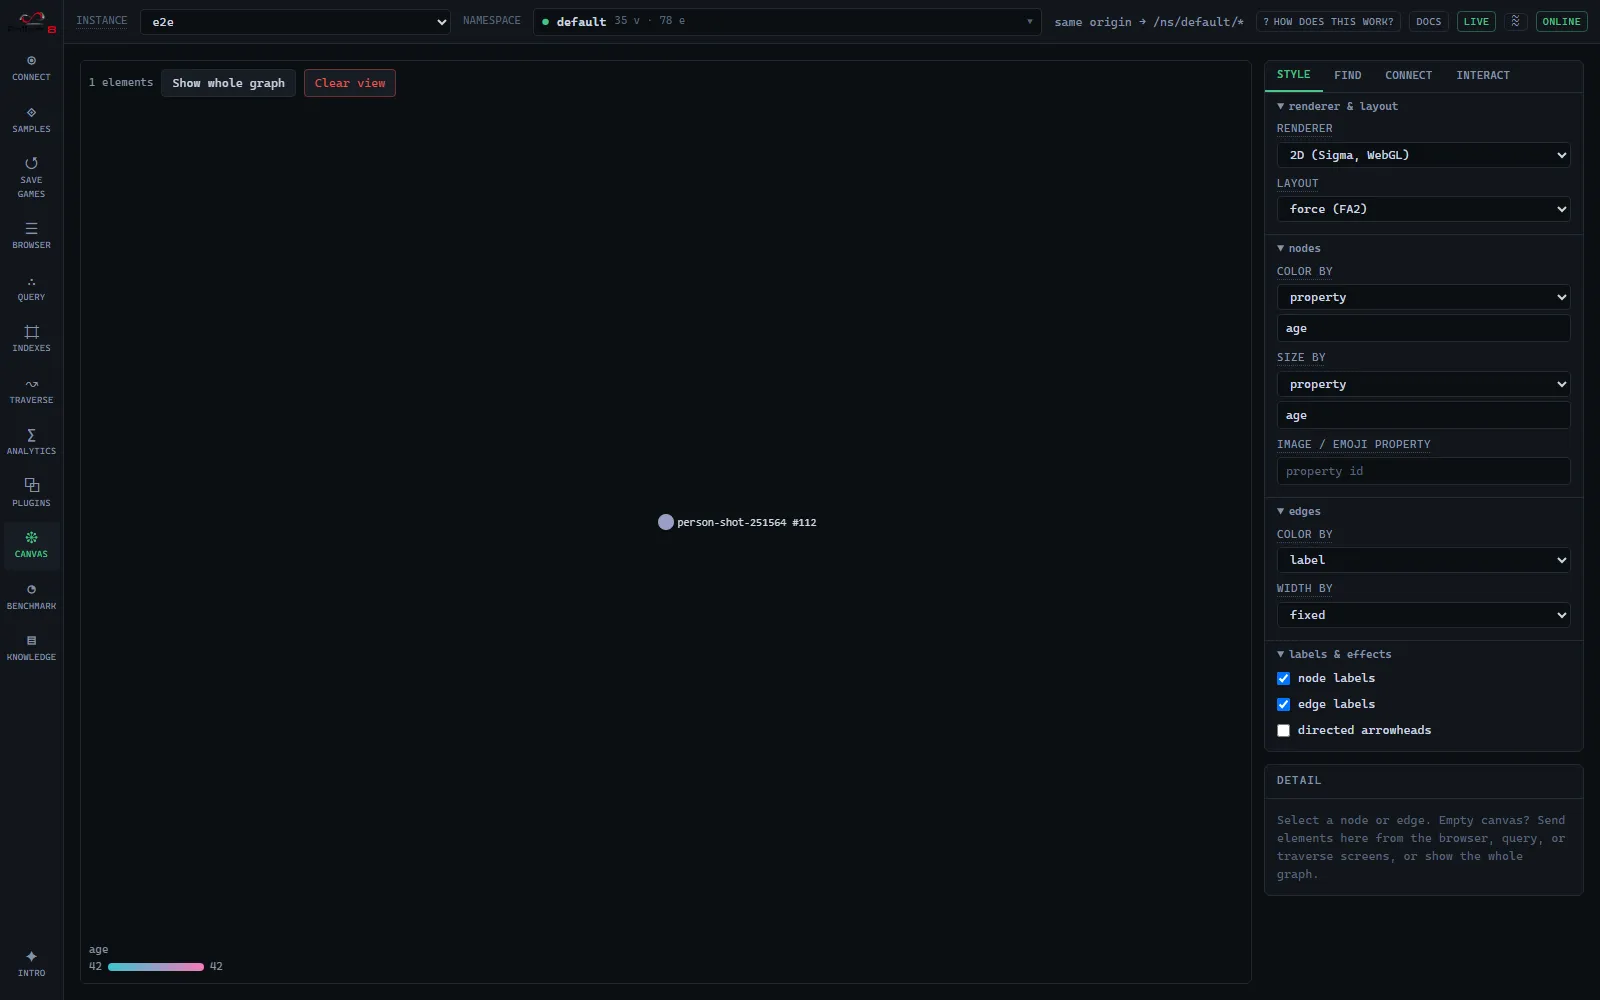
| Section | Controls |
|---|---|
| renderer & layout | 2D (Sigma, WebGL) or 3D (three.js); 2D layouts force/circular/circle-pack/grid/random, 3D force/dag-top-down/dag-radial |
| nodes | color by label or property; size fixed, by property, or by in-/out-/total degree; image or emoji from a property |
| edges | color by label or property; width fixed or by property |
| labels & effects | node and edge label toggles, directed arrowheads |
When you switch color by or size by (and the edge equivalents) to property, a text field appears directly under the picker for the property key. It is seeded with the first property present on the canvas so it is never blank, suggests the other keys as you type, and stays free text, so you set the key yourself. You do not hand-pick the colors: each distinct value gets a stable color from a fixed palette, unless every value is numeric, in which case elements shade along a cyan→pink gradient; missing or blank values render grey. Sizes and widths from a numeric property are min-max scaled into a range. For edges, “label” anywhere on this panel means the display name: the edge’s optional label, falling back to its type, edgePropertyId (edge type vs label).
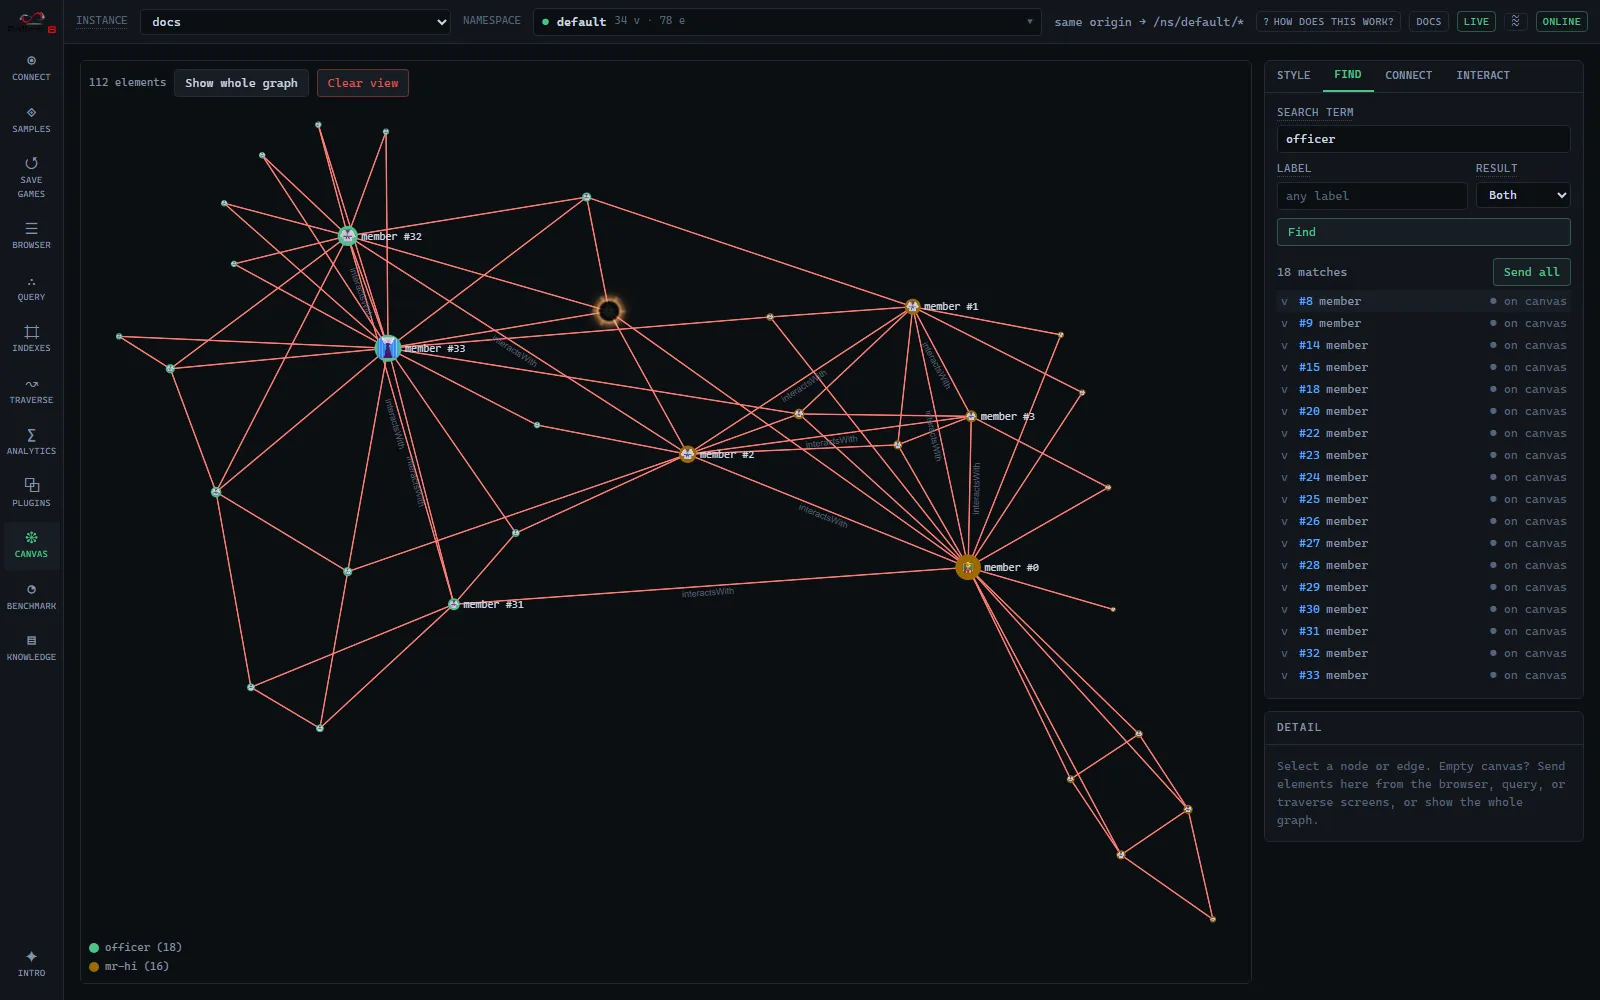
Find searches the whole graph without leaving the canvas. It reuses the all-property search (a case-insensitive substring across every property value, optionally narrowed to one label), so you type a term (e.g. acme), pick vertices/edges/both, and get a compact result list of matches. Each row shows the element’s id and label, whether it is already on the canvas, and a one-click add; Send all adds every match at once (the first 500 are hydrated). Clicking a row’s id selects it into the detail panel below, so you can inspect an element’s full properties before deciding to add it. Hovering a row spotlights that element’s node on the canvas with a brief eclipse-style corona, so you can see where a match already sits before adding more. It is an un-indexed discovery scan; for hot or very large graphs, an index is the right tool.
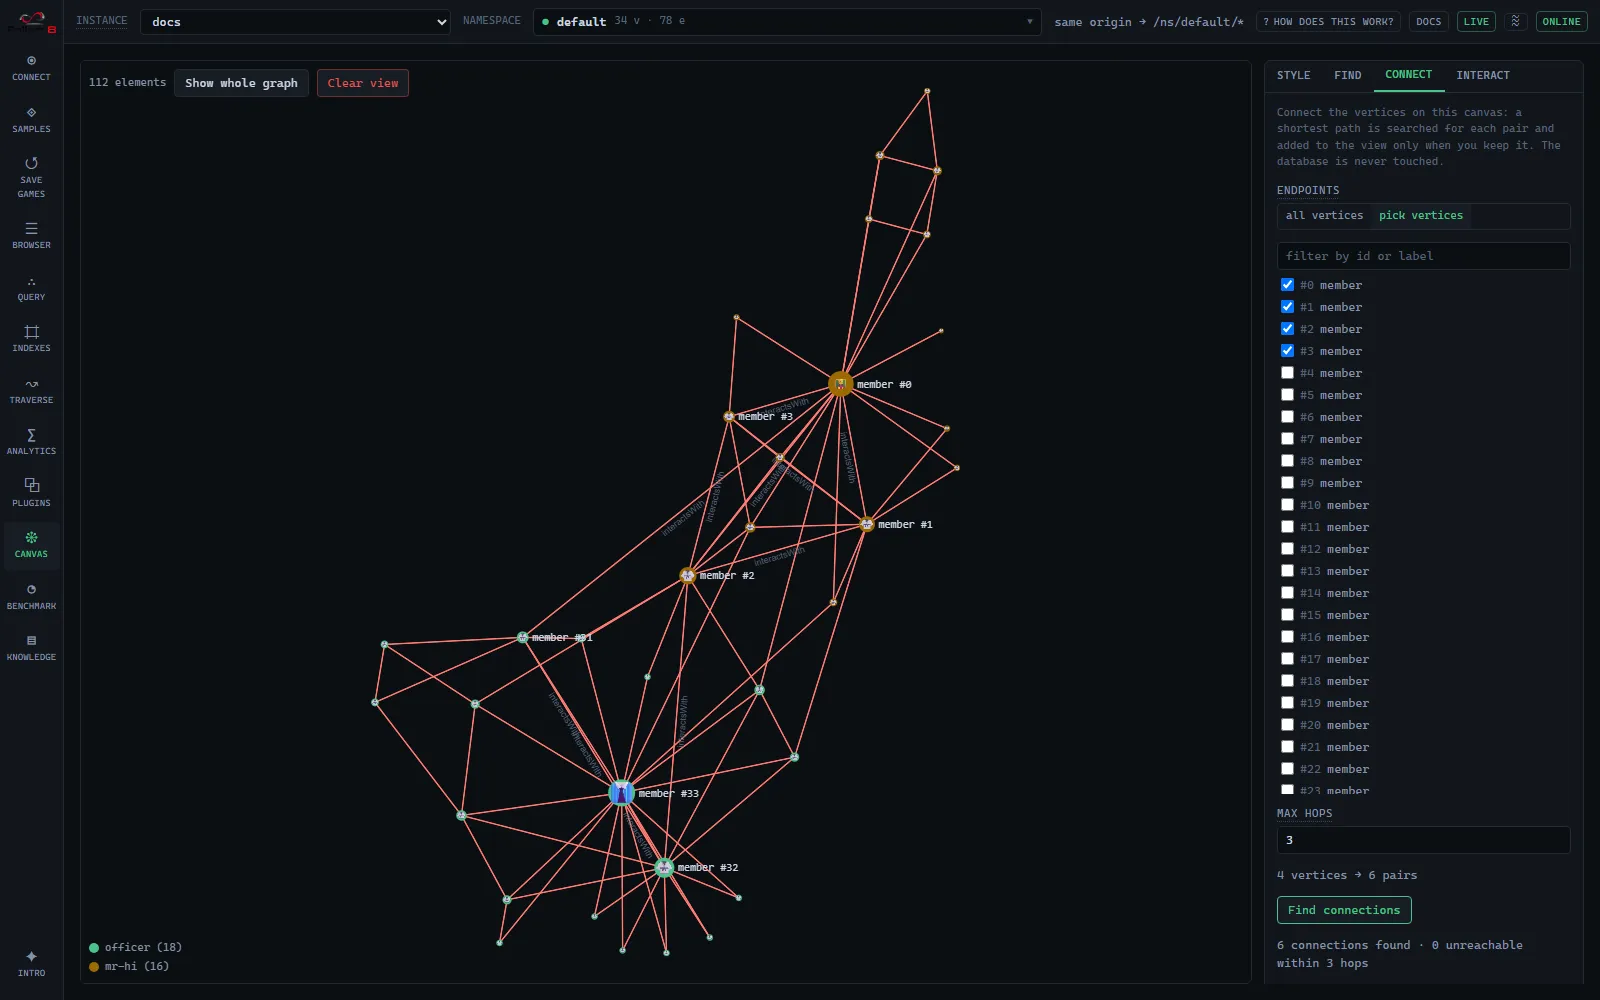
Connect reveals how the vertices already on the canvas relate. It runs Fallen-8’s shortest-path search (BLS) between every pair of canvas vertices, up to a max hops you set, and lists each connection it finds. Point it at all canvas vertices or pick a subset from a filterable list; the panel always shows how many pairs a run will search and refuses to start above a 500-pair budget (pick fewer vertices to narrow), because a partial sweep would falsely report pairs as unreachable. A long run shows per-pair progress and can be cancelled. Each found connection can be added or removed individually (or all at once): adding merges only the intermediate vertices and edges the path introduces, and removing a connection keeps any intermediate that another kept connection still runs through. Nothing here touches the database; it is all view assembly.
Interact applies the same two verbs to many vertices at once. You filter the canvas down to a match set, then Expand every match’s neighborhood or Remove every match from the view. There is no “all” switch: with no filter set the match set is simply every vertex here, which is how you expand the whole canvas (to empty it, “Clear view” in the toolbar is the one-step way). Four filters combine, and each is off while its field is blank; a row you have half filled in, such as a value term with no property key, disables both verbs and says what is missing rather than quietly matching everything:
- label, matched exactly (a vertex the canvas holds only as an edge endpoint has no label read yet, so it never matches one);
- property, a key with an optional value term, matched against the canvas snapshot (scalars, strings capped at 200 characters, so the Find tab remains the server-side search);
- degree, over or under a number in the direction you pick, counted either from the database (the vertex’s true degree, so “remove the real hubs” means what it says) or from edges on canvas (instant, and the number you actually see: a vertex you never expanded reads 0 here);
- semantic distance, keeping vertices whose stored embedding is closer or farther than a threshold from a text you type. The threshold is in the index metric’s own raw units, exactly as a search reports them, and the panel names the index and which direction its metric calls “closer”. The row appears only where an embedding provider and a bound vector index can answer it, and says which is missing otherwise.
Database degree and semantic distance cost server round trips, so they run behind Preview, which shows the evaluated match set as a hoverable list before anything happens to it. Editing a filter or changing the canvas retires that result and asks you to preview again, because acting on a match set the canvas has moved on from is exactly the mistake worth preventing.
What it could not measure is always counted rather than folded into the answer, because a bulk remove deserves better than a confident number. A vertex the semantic search returned no score for matches neither direction: it may carry no embedding, or sit outside the nearest-1024 window the search ranks, and either way nothing measured it. A vertex whose degree the server would not answer (deleted since it landed on the canvas, say) is likewise left out rather than counted as zero, so “under 5” cannot sweep it up. Both appear next to the match count.
An expand sweep is capped at 100 matched vertices (each one costs several requests), reports how many it really expanded, names any hub whose neighbourhood the per-vertex edge cap cut short, and stops at a 40,000-element canvas ceiling rather than looking like a graph with fewer neighbours. Cancel appears whenever something is running, filter or no filter, and abandons the requests already issued rather than merely ignoring their answers. It works in whole batches: the vertices already merged stay, and the batch in flight is dropped without being counted, so the report never credits an expansion that did not land.
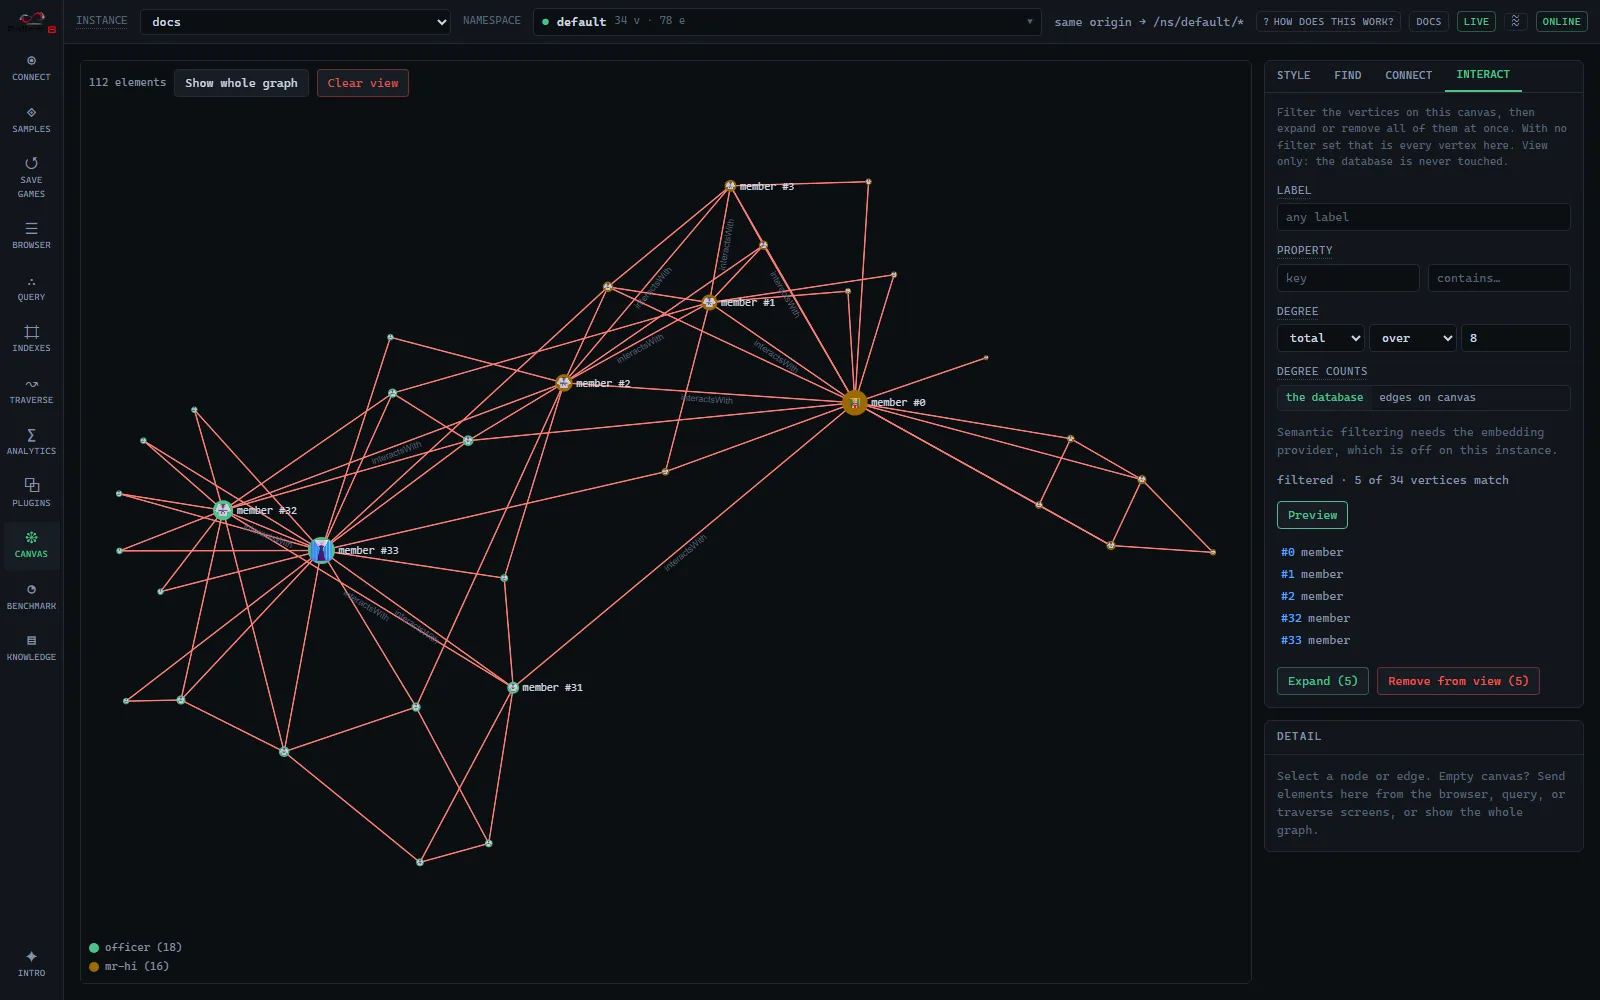
A legend (categorical or gradient) reflects the active color mode. Selecting a node or edge (on the canvas, or from a Find or Interact result) opens the detail panel with its properties; Expand neighbors merges that one vertex’s 1-hop neighborhood, and Remove from view affects only the canvas: it never deletes from the database. Those two are the single-element form of the Interact tab’s verbs and run the same code. A path found on the Traverse screen arrives as a highlighted overlay.
Traverse
Section titled “Traverse”One screen for the two ways of walking a graph, in three tabs: Path finding, Subgraph builder, and Stored queries (whose label carries the entry count). The two scenarios were near-twins already, wiring the same filter-source toggle, the same delegate slots and the same editor over one stored-query library, so they share a screen instead of a rail entry each.
Switching tabs hides the inactive ones rather than discarding them: a path result, an open advanced tier, or the builder’s message line survives a tab switch exactly as the form drafts do. Only an instance or namespace switch resets them, as everywhere else. The active tab rides the URL as ?tab=path, ?tab=subgraph or ?tab=stored, so any tab is deep-linkable; without the parameter you land on the tab you last left, remembered per instance and namespace. Bookmarks to the two screens this one absorbed keep working: /q/{ns}/path and /q/{ns}/subgraphs (and the flat /path and /subgraphs) redirect onto the matching tab in the same namespace.
Path finding
Section titled “Path finding”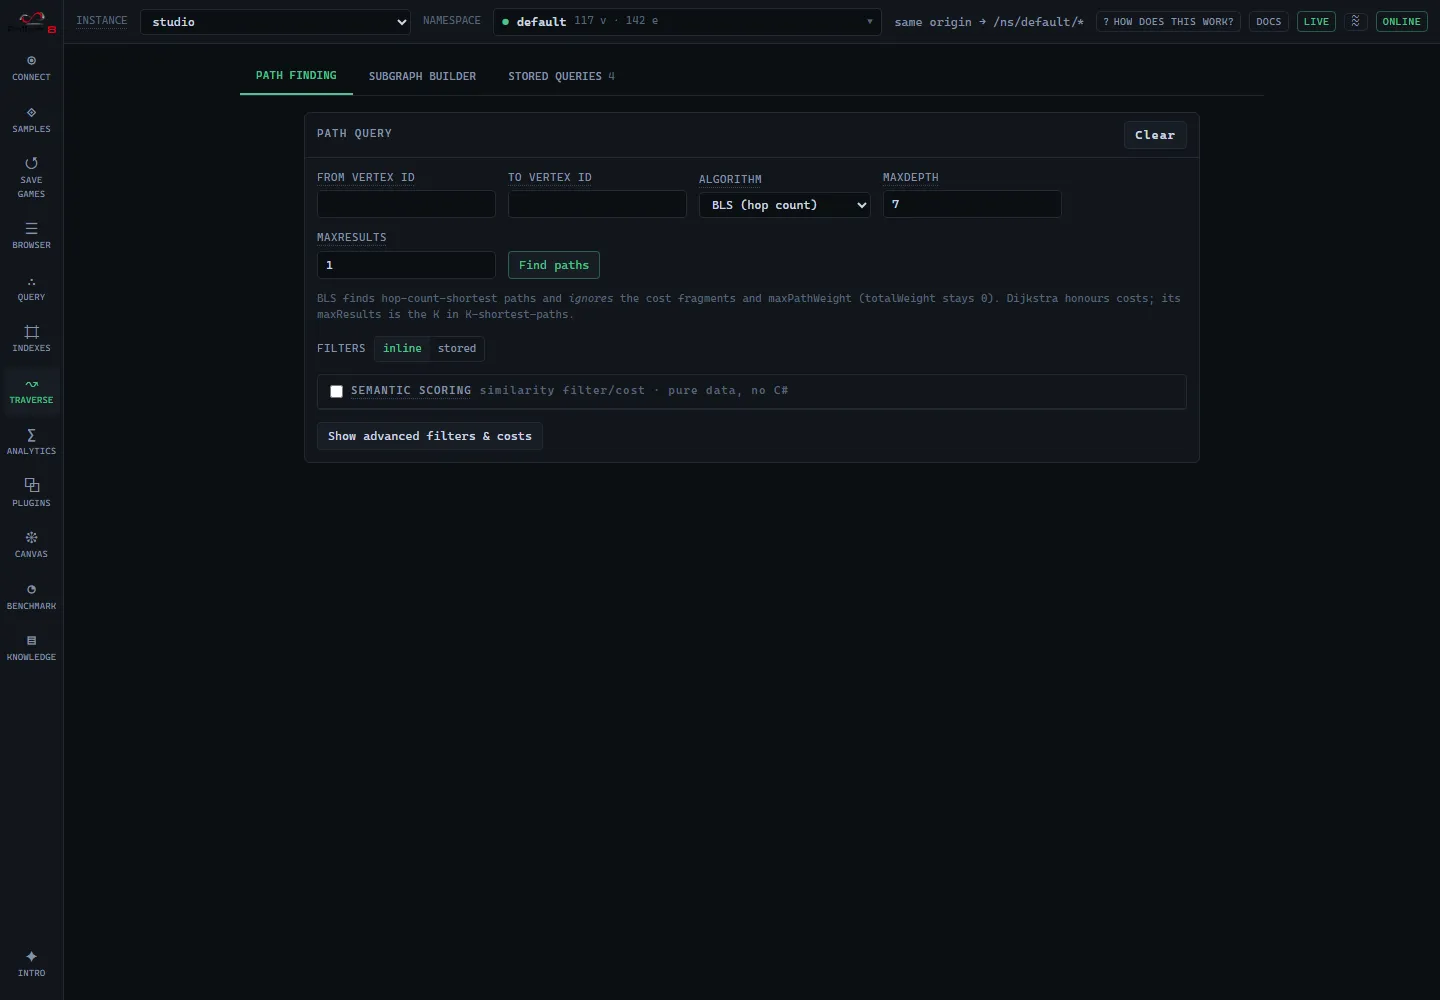
From/to vertex ids, algorithm BLS (hop count) or Dijkstra (weighted), maxDepth, maxResults (the K for Dijkstra’s K-shortest-paths), and maxPathWeight (Dijkstra only; BLS ignores costs). The algorithm picker also lists this namespace’s runtime-registered path plugins, marked (registered), so a plugin authored on the Plugins screen becomes usable here. Filters and costs come from inline fragments or a stored query, kept mutually exclusive by a source toggle. The inline advanced tier exposes five delegate slots (filter.vertexFilter, filter.edgeFilter, filter.edgePropertyFilter, cost.vertexCost, cost.edgeCost) each authored in the delegate editor, and the set can be saved as a stored query. A semantic scoring block (query vector + minScore filter + costBySimilarity) is pure data and compiles no C#. Results list each path’s hops and total weight with “Overlay on canvas”.
Because fragments are validated in the editor before the query runs, an empty result here is a genuine “no paths found” rather than a swallowed compile error. Inline fragments always run (dynamic code execution is always on); on a key-protected instance they need the API key like any other request. Algorithm behavior: path-finding.md; semantic scoring: semantic-traversal.md.
Subgraph builder
Section titled “Subgraph builder”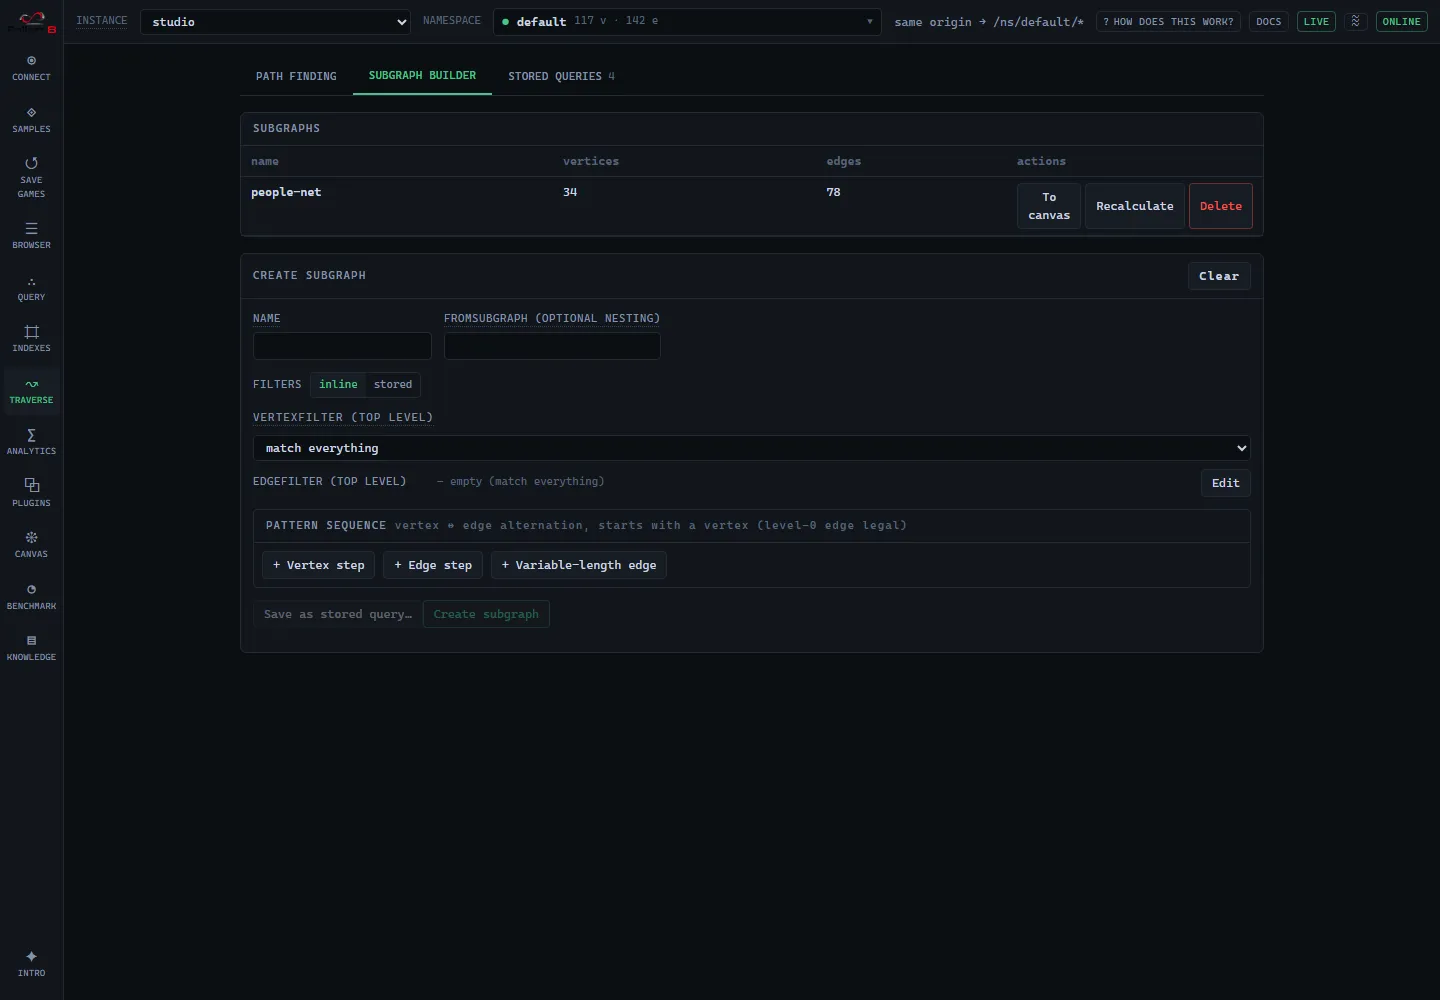
A table lists existing subgraphs (with a badge for semantic ones) offering To canvas / Recalculate / Delete. The create form takes a name and an optional fromSubGraph for nesting, an inline-or-stored source toggle, a top-level vertexFilter (fragment or semantic mode) and edgeFilter, and a pattern sequence builder: add Vertex, Edge, or Variable-length edge steps with type, name, direction, and min/max length. Vertex↔edge alternation is validated as you build. A semantic query section appears when any vertex slot is in semantic mode (one query per request, bound at creation), and the whole specification can be saved as a stored query. Concept and rules: subgraphs.md.
Stored queries
Section titled “Stored queries”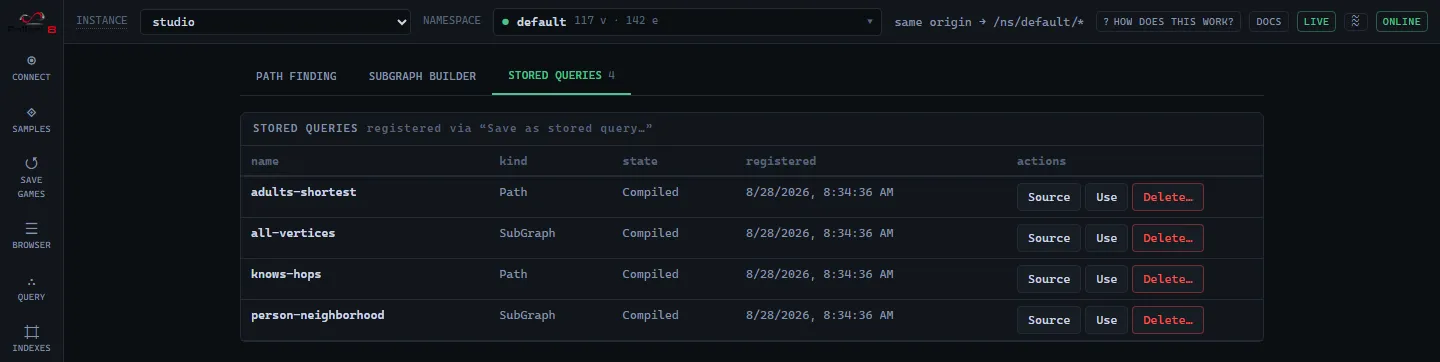
One table over this namespace’s whole stored-query library, both kinds together, with a kind column naming each entry’s scenario (Path or SubGraph). Per row: read-only source with recompile diagnostics, Delete behind a typed confirm (entries are immutable, so delete and re-register is the edit flow), and Use, which switches to that entry’s own scenario tab and selects it there in stored mode. An entry whose recompile failed cannot be used and says why.
Registration is not here, because it belongs where the fragments are: Save as stored query… sits in each scenario tab’s inline advanced tier, next to the slots it captures, and on success flips that tab to stored mode rather than sending you to the library. The wire model, limits, and durability: stored-queries.md.
Analytics
Section titled “Analytics”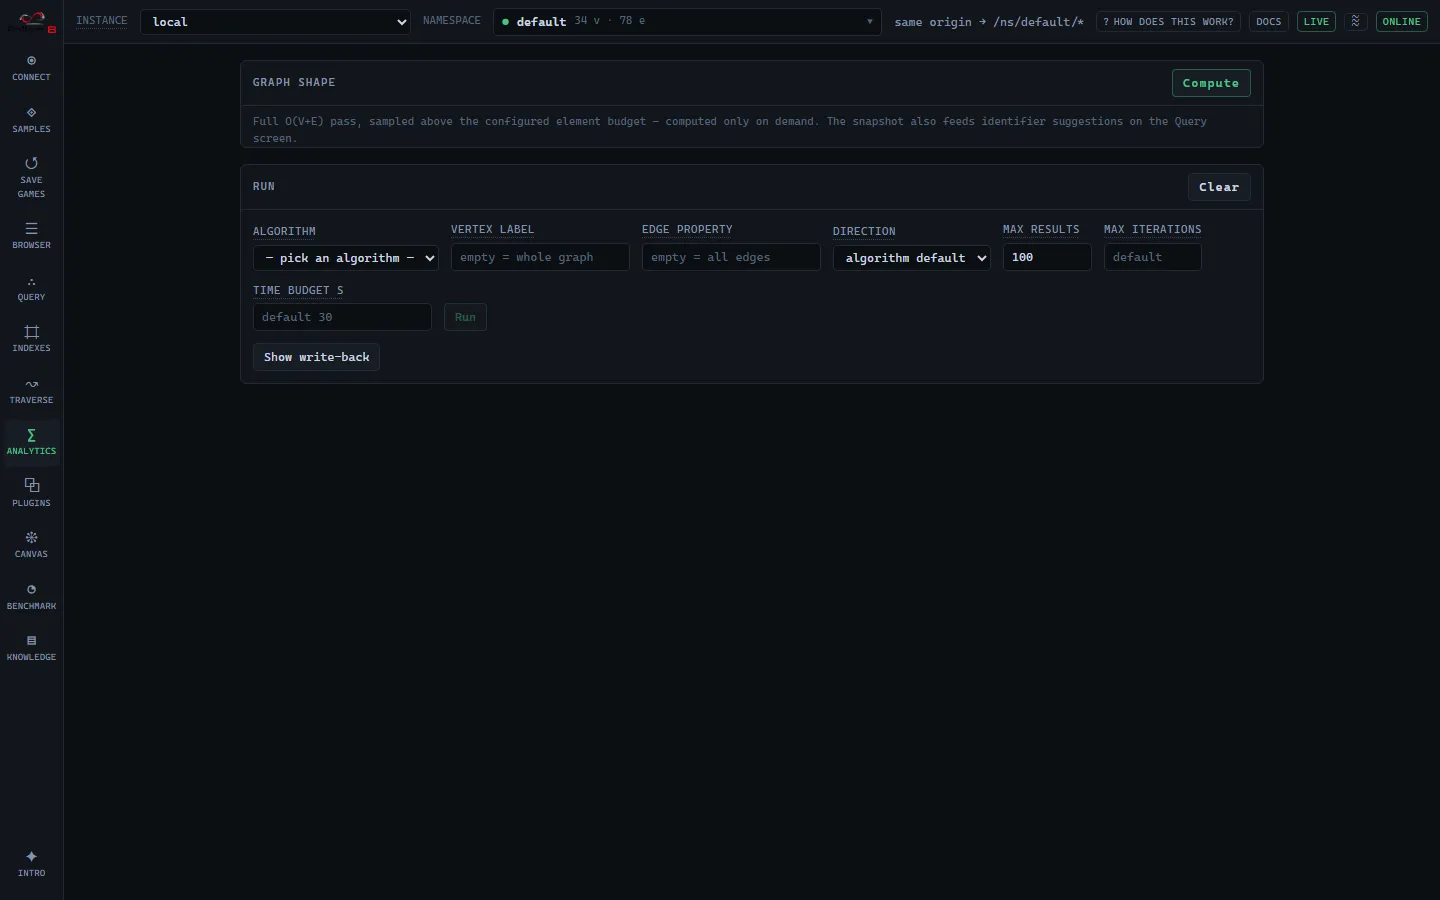
Graph shape runs an on-demand GET /statistics pass, counts, top vertex/edge labels and property keys, degree percentiles, and the index list; its snapshot also feeds identifier suggestions across Studio. Elements the server tallied under no label (and properties under no key) keep their own bucket, rendered as a faint <no label> / <no key> row, so the cardinality lists always add up to the totals. Run picks an algorithm from the live plugin list, scopes it by vertex label / edge property / direction, and sets max results, max iterations, and a time budget (PageRank adds damping and epsilon). Optional write-back stamps each score onto a vertex property (snapshot-durable only), which you can then color by on the Canvas to read results spatially. The result panel shows convergence, statistics, partitions with paged members, and a scored table. A run already in progress returns 429; an exhausted budget returns 408. Algorithms and semantics: graph-analytics.md.
Plugins
Section titled “Plugins”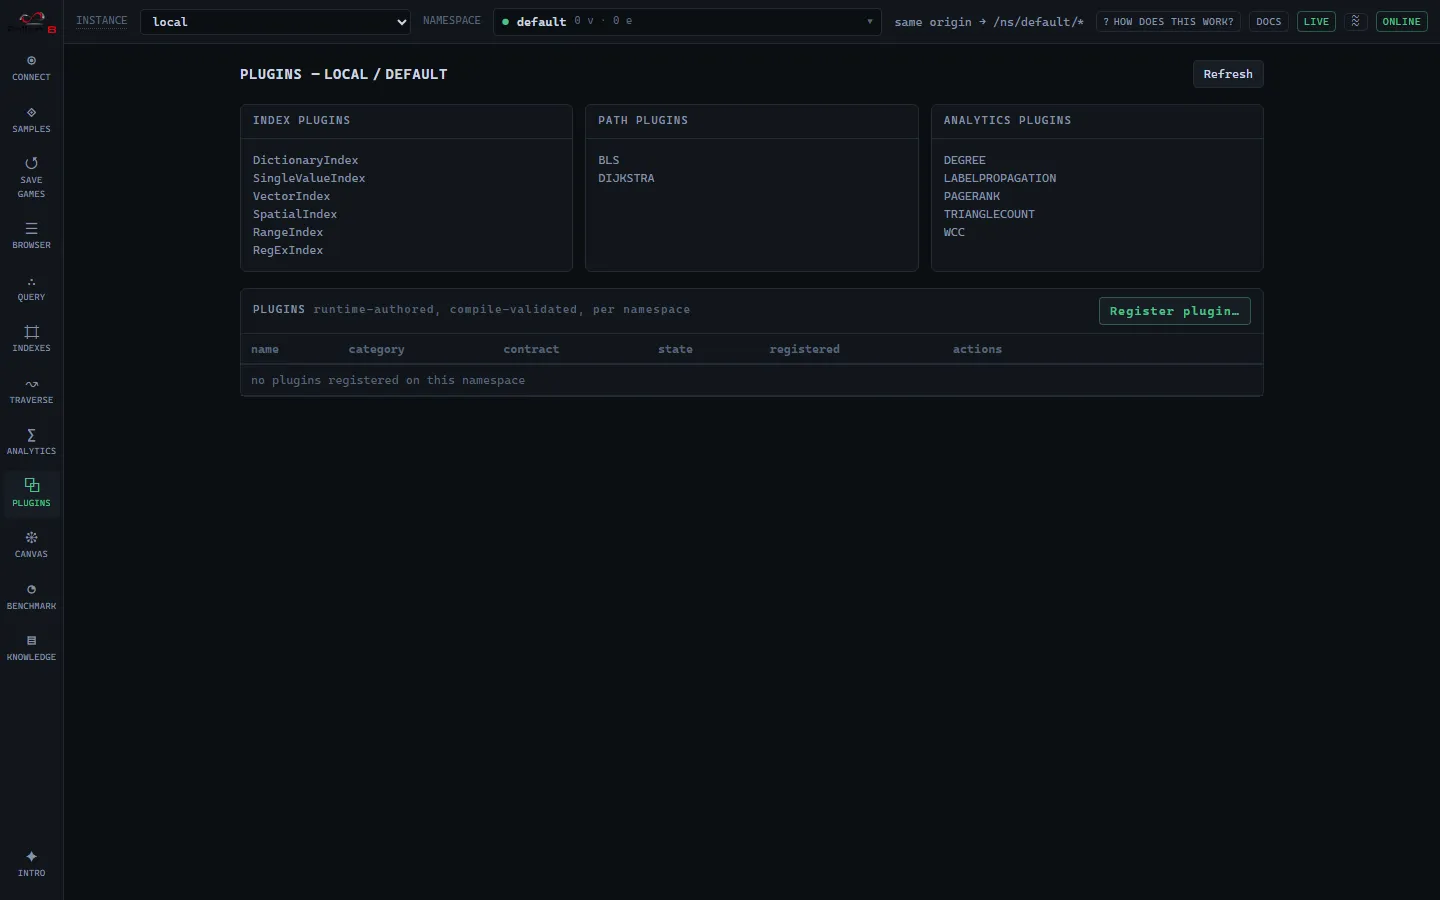
The one home for everything plugin-related. The top row shows the built-in plugin families discovered on the engine (index / path / analytics) from GET /status. Below it, the registry table lists the active namespace’s runtime-authored, compile-validated plugins (name, category, contract, and compile-state badge) with read-only source and recompile diagnostics, a function runner for a registered graph function, and delete (entries are immutable: delete and re-register is the edit flow). Register plugin… opens the whole-type authoring editor. Registrations are per namespace. Concept and REST: plugins.md.
Indexes
Section titled “Indexes”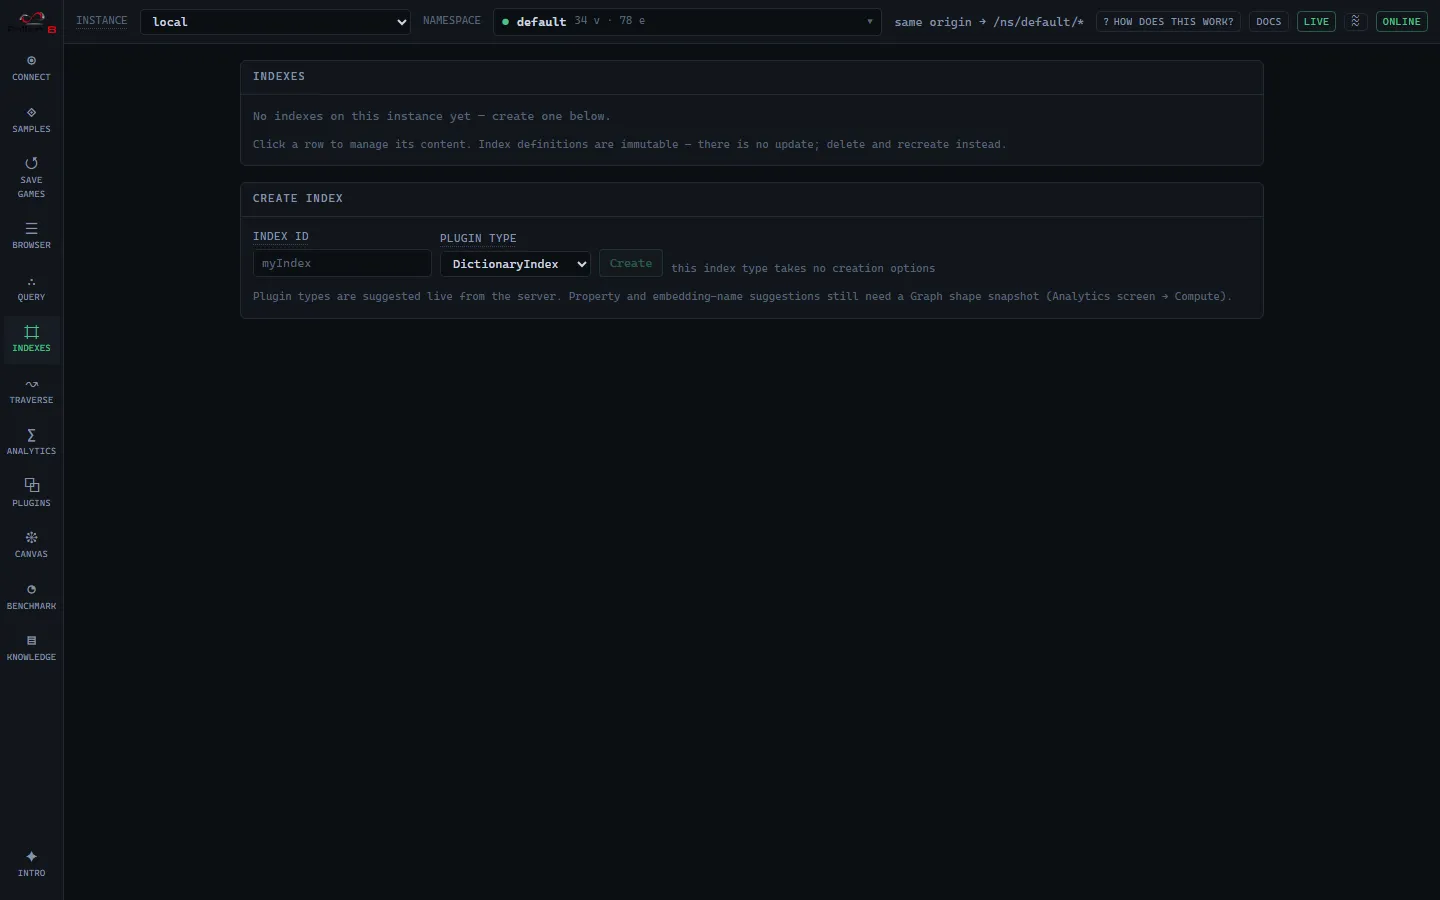
The inventory table shows each index’s id, type, query capabilities, key/value counts, and a binding badge when a vector index is bound to a named embedding (a self-maintained projection). Row actions are Query (jumps to the Query screen with the index preselected) and Delete (typed confirm). Create takes an id and plugin type; a VectorIndex adds dimension, metric, and an optional embedding binding and model. SpatialIndex cannot be created over REST. Per-index content management (typed-key add/remove, vector add, element remove) follows the index’s capabilities: a bound vector index manages its own content and rejects manual writes. When the inventory holds indexes but none that can rank a vector, one line under the table names what a semantic search would need, because an inventory of other families otherwise reads as “this instance cannot search by meaning”. Index types and REST: indexes.md.
Save games
Section titled “Save games”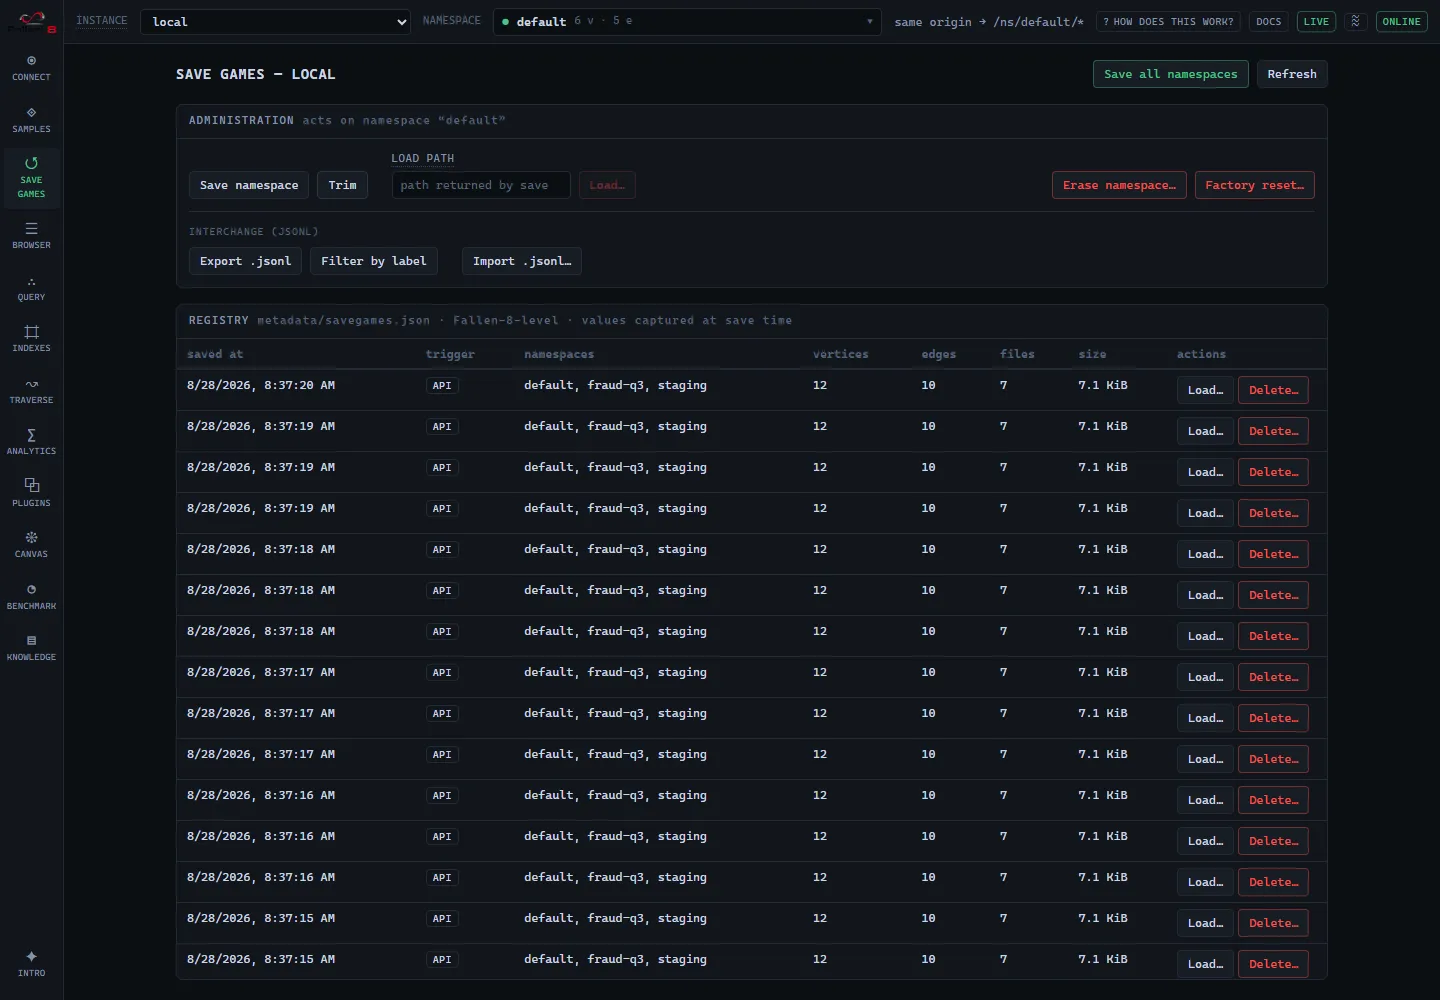
The persistence home. The top is the Administration section, holding the namespace-scoped persistence and lifecycle actions (they act on the active namespace shown in the top bar): Save namespace, Trim, Load from a checkpoint path, Erase namespace, and the Fallen-8-wide Factory reset (the destructive actions require typing the target name). An interchange (jsonl) subsection exports the graph (optionally filtered by label or edge type) and imports jsonl into an empty graph, import requires an empty target, which the server enforces with a 409 (bulk-import-export.md).
Below it is the persistent checkpoint registry as a Fallen-8-level table: saved-at, trigger, member namespaces, aggregate counts, file count, and size. “Save all namespaces” writes one entry spanning every namespace; Load restores the entire entry or a single namespace (typed confirm); Delete optionally removes the checkpoint files on disk. The registry lists every entry; once it grows past about fifteen rows it caps its height and a scrollbar scrolls through the rest, so a long save history never grows the page (no rows are hidden below a 10,000-row safety ceiling). Semantics: save-games.md.
Benchmark
Section titled “Benchmark”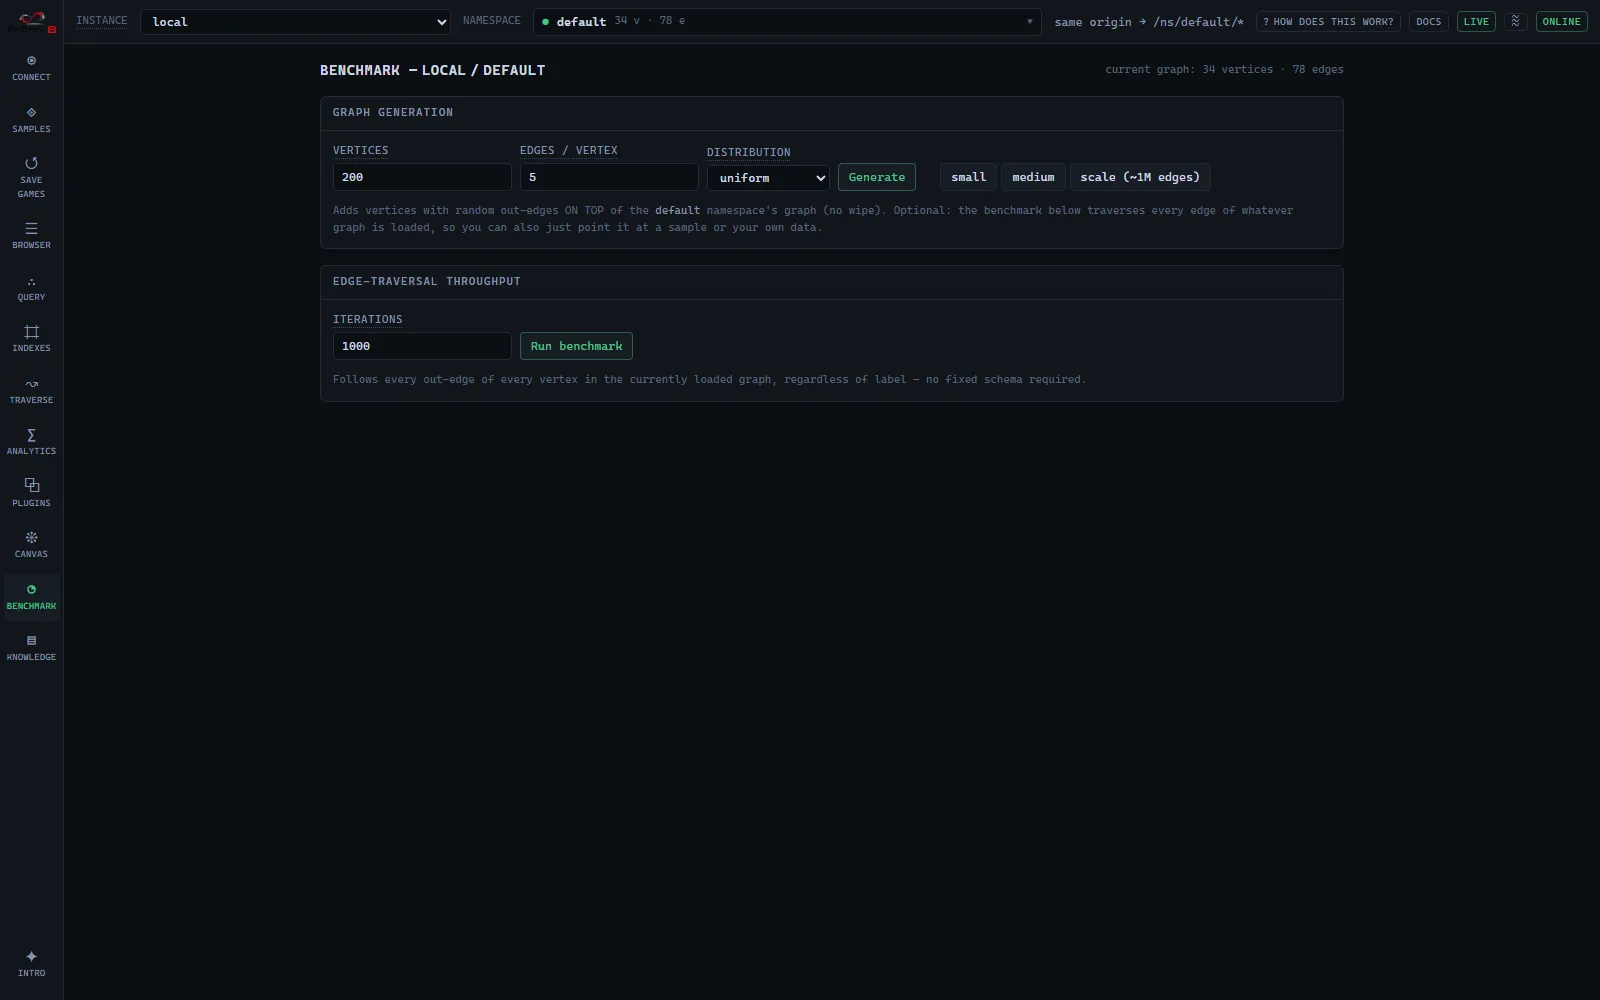
Namespace-scoped: both panels act on the namespace in the top bar, and the header names it. Graph generation optionally adds random vertices with out-edges on top of that namespace’s graph (no wipe), then reports what it created, how long it took, the resulting totals, and the namespace the server wrote into; you can equally point the benchmark at a sample or at your own data. The edge-traversal run then follows every out-edge of every vertex and reports edges per run and average/median/stddev TPS, with a per-session history. It measures raw edge-traversal throughput, not query latency or analytics. Presets, what the numbers mean, and the REST equivalents: benchmark.md.
The delegate editor
Section titled “The delegate editor”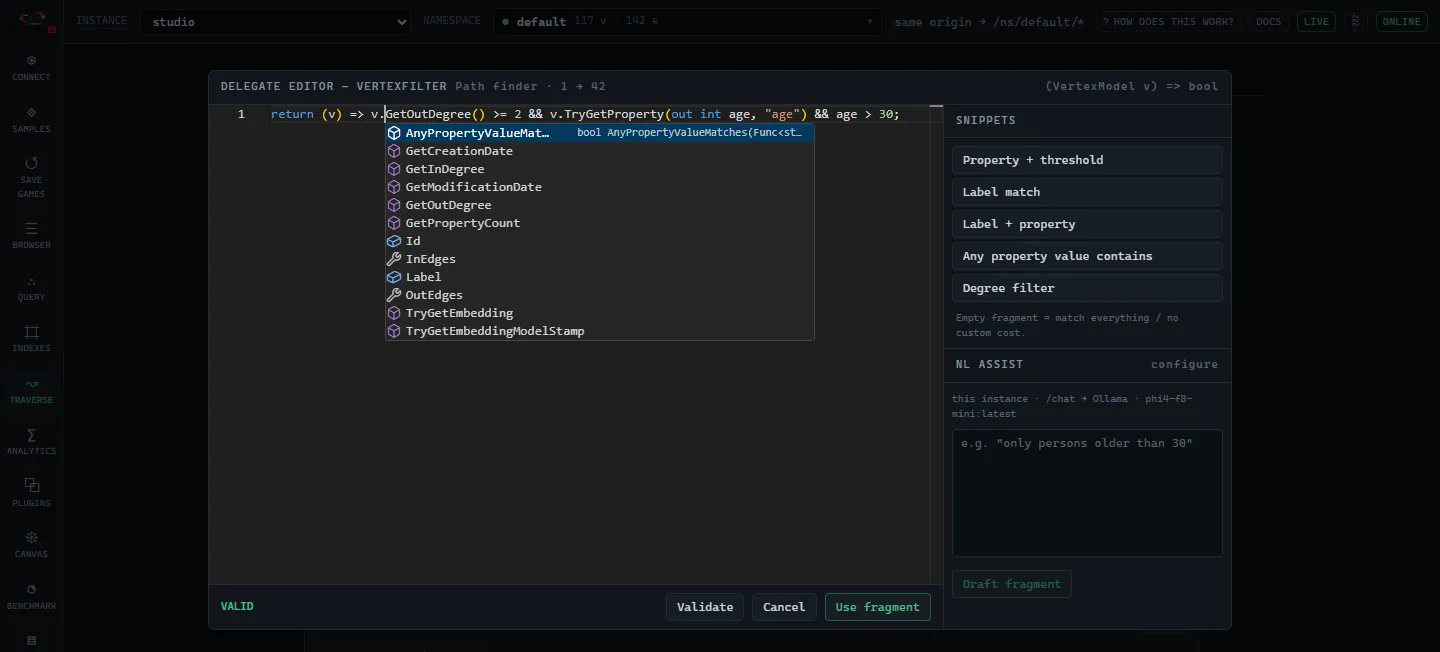
Opened from every fragment slot on the Traverse screen’s two scenario tabs (the Query screen uses no fragments). It is a Monaco C# editor with per-kind snippets for the five slot types, VertexFilter, EdgeFilter, EdgePropertyFilter, VertexCost, EdgeCost. It validates as you type against the server (POST /delegates/validate) and renders diagnostics inline at the returned positions; Use fragment is blocked until the exact text on screen has passed validation (an empty fragment means “match everything”). Validation and inline fragment execution are always available; they only need the instance’s API key when one is configured (security.md). The compilation model is owned by delegates.md.
Completions, hovers and signature help come from a static type model that ships inside Studio rather than from a language server, and they are scoped to the slot: after v. a VertexFilter offers the VertexModel surface, after e. an EdgeFilter offers the edge surface, and an EdgePropertyFilter, whose parameter is a plain string, offers string members and no graph model at all. Only the slot’s own parameter completes; any other identifier gets nothing. Away from a member access the list is the parameter itself plus the same per-kind snippets the snippets panel offers as buttons, so an empty slot can reach a working fragment without leaving the editor. Typing ( opens signature help, which is how the TryGetProperty(out T result, string propertyId) idiom most fragments need becomes discoverable instead of something you have to be told. The model is a reading aid and POST /delegates/validate stays the only compile authority, so a member can be offered here and still be out of reach in a fragment: that surface, and the members the narrow compile environment cannot reference, are owned by delegates.md. The plugin authoring editor shares the C# colorization and the NL panel but has no member completions, because a whole plugin type is not one typed lambda.
NL assist
Section titled “NL assist”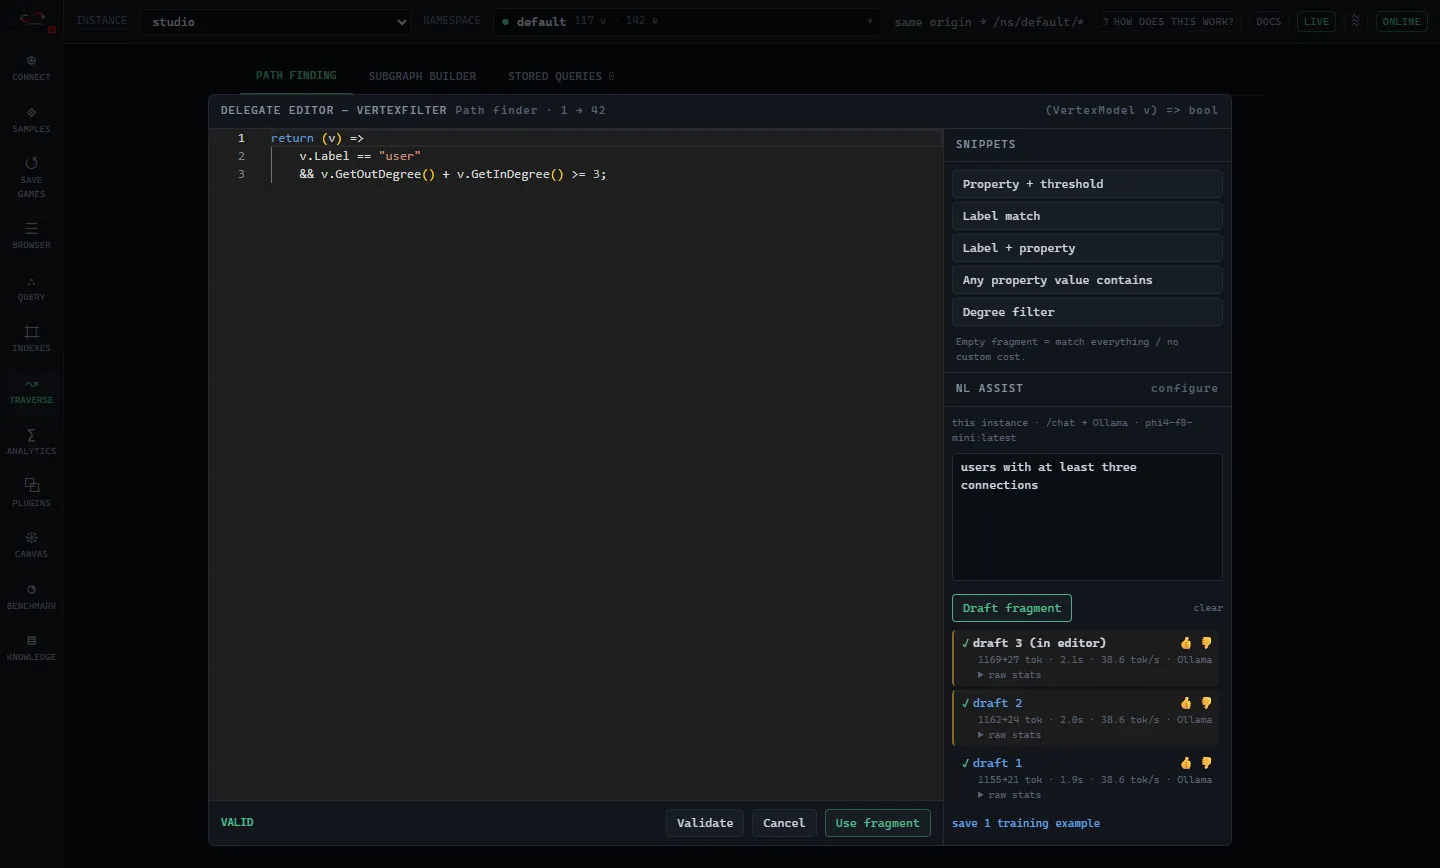
The editor’s side panel drafts a fragment from a natural-language description, calling a model through one of two backends:
| Setting | Detail |
|---|---|
| backend | this Fallen-8 instance (default) or custom endpoint (browser-direct) |
| instance mode | browser → the active instance’s POST /chat → whichever backend Fallen8:Chat selects (Nahil by default; also the Ollama sidecar, OpenAI or Anthropic, model-providers.md). The model is server-owned; nothing to configure. The panel names the backend and model it is routed to, and each draft’s stats line names the backend that draft came from. Needs the instance’s chat gateway enabled (Fallen8:Chat:Enabled / F8_CHAT), semantic-traversal.md. |
| custom mode | the browser calls the endpoint directly; api kind ollama or openai-compatible; presets for the fine-tuned phi4-f8-mini/phi4-f8, stock phi4-mini/phi4, OpenAI, Anthropic. Any API key is held only in the browser and never sent to a Fallen-8 instance. This is a different thing from configuring the instance for the same provider, which is the better home for a key (model-providers.md). |
Instance mode is the default because Fallen-8 is now the semantic gateway (embeddings and chat both proxy through the instance). This retires the earlier “never through the Fallen-8 instance” rule for the default path: the prompt travels to the same instance you already trust with your graph, so instance mode shows no egress notice; the surviving guarantee is that a custom endpoint and its key stay browser-direct and never reach F8. A non-loopback custom endpoint still shows the “text leaves this machine” notice.
Each draft is inserted as ordinary editable text and run through the same validation the editor uses, never auto-submitted; on an invalid draft the editor feeds the compiler diagnostics back to the model and retries a bounded number of times before stopping. Drafts accumulate in a scrollable list with the newest on top; each is highlighted as awaiting review until you judge it 👍/👎, and the rated ones can be exported as training examples. A model that is not present on the backend makes the call 404 (troubleshooting.md). The plugin authoring editor’s NL panel works the same way.
Server capabilities Studio uses
Section titled “Server capabilities Studio uses”Studio degrades gracefully when a capability is off, but these features need server-side support:
| Studio capability | Needs on the server | Docs |
|---|---|---|
| Delegate validation + inline path/subgraph filters & costs | The API key when one is configured (dynamic code is always on) | security.md |
| NL assist drafting (instance mode, default) | The chat gateway enabled (Fallen8:Chat:Enabled / F8_CHAT) + its configured backend reachable |
model-providers.md |
| NL assist drafting (custom mode) | A reachable model backend the browser calls directly (OLLAMA_ORIGINS for a browser-direct Ollama) |
security.md |
| Text-in embedding, semantic search, text query vectors | Embedding provider enabled | semantic-traversal.md |
| The whole Knowledge screen (document ingest, chunk search, entities) | Ingestion enabled (Fallen8:Ingestion:Enabled / F8_INGESTION), plus the docling sidecar for pdf/docx/xlsx/pptx/html; without it, txt/md only |
unstructured-ingestion.md |
| The entity network over ingested documents | The NLP sidecar (Fallen8:Nlp:Enabled / F8_NLP); enrichment is additive, so ingestion still succeeds without it |
unstructured-ingestion.md |
Stored-query invocation (kind Path / SubGraph) |
The API key when one is configured (no capability gate on top of it) | stored-queries.md |
| Live chip, push refreshes, the Events panel | Change feed enabled | change-feed.md |
| “Any GitHub repo” sample card | Internet access to GitHub’s dependency graph | samples.md |
See also
Section titled “See also”- running.md: how Studio is built and served
- delegates.md: the delegate model Studio helps you author
- namespaces.md · security.md · rest-api.md: the model and surface behind the UI